

FRI 1 MAY 2020
Summary
The risk of a global recession is rising by the day, rapidly deteriorating labour markets, economic output, and demand around the world. Q2 economic data is expected to be weak, double-digit contractions are a very real threat despite the significant amount of fiscal and monetary stimulus. However, in the near term, as coronavirus cases and fatalities start to fall and lockdowns are eased, this could improve risk appetite in financial markets. If mine suspensions continue into June, this could strengthen tailwinds for prices. We expect rallies to be sold due to the backdrop of a global recession and elevated inventory levels.
Aluminium
The smelter cutbacks have softened demand for alumina in the near term, but more cutbacks may be needed to counteract weak primary aluminium demand. We expect spot prices for alumina to fall in the coming months; in China, there is little appetite for imported alumina due to the domestic surplus. European car producers have implemented output suspensions as a form of virus containment and response to weak demand conditions; impacting output for aluminium products such as sheet and castings. Aluminium has been well bid below $1,400/t since 2003, and we expect prices to run into resistance around $1,700/t.
Copper
Copper demand has been severely hampered by the coronavirus as end-users as unemployment increases and demand for good and services declines. It could take years for demand to get to pre-pandemic levels. Stimulus packages are expected to alleviate some pressure on the copper market. Chinese smelter inventories are high, but we expect production to improve. Near term, momentum is promising for copper as COVID cases, and deaths start to decline in consumer countries and lockdowns are eased, even though labour issues in producing countries may mean mine suspensions continue. Weak economic data in the medium to long run will cap prices. Range $4,800/t – $5,500/t.
Lead
Demand for lead is expected to remain under pressure due to the weak auto industry data. China auto production will come back online first but remains low on a historical level. Battery output has also been weak. We expect supply suspensions due to the virus, but the lack of demand will cap gains. Indeed, when mines come back online, we believe the price will have another leg lower as consumption remains subdued. Weak auto demand in Q2 will keep the trend intact if consumers prefer EVs over ICE then this may dampen leads outlook in the longer run. $1,500/t – $1,850/t.
Nickel
Nickel ore inventories are high, and we expect stocks to be withdrawn in 2020, and this could give rise to prices on the LME in H2 2020. Exchange inventories have risen in 2020 to 229,062 and 28,145 on the LME and SHFE exchange respectively. Stainless inventories in China are high, but the lack of ore could prompt NPI production to fall. EV sales have been weak, but we expect sales to start improving in the coming months. Improving stainless production in China will benefit nickel, but we expect the majority of trading to take place between $10,000- $13,800/t, a comparatively wide range in these uncertain times.
Tin
Chinese customs data for tin shows that imports of unwrought tin and alloys surged higher in the first two months of 2020 to 1,771 tonnes. Demand remains weak, and the pre-virus semiconductor sales paint a grim outlook in the immediate term. Mine suspensions caused LME prices to rise as concentrate imports into China fall. Despite weak semiconductor sales, we anticipate prices for tin to edge higher in the near term. We expect prices to be well bid below $13,750/t, the top of our Q2 range is $18,000/t.
Zinc
The low TCs and zinc prices will likely cause some mines to close for longer than the lockdown. The surplus looks set to be the largest since 2010 when the balance reached over 1.2m tonnes. Demand has fallen significantly, and we expect this to remain the case in the medium term. Operation rates are expected to rise in the coming months. Galvanizers’ stock days of consumption have increased, but these could fall as smelter output starts to rise. Galvanizers operating rates are strong, but the diecasting rates remain lacklustre, and we expect zinc consumption to remain subdued. Range $1,700/t - $2,200/t.
Iron Ore & Steel
Fixed asset investment in China fell 24.5% Y/Y in the first two months of the year. Indeed, this could present some downside to iron ore and steel demand forecasts if this continues. Iron ore spreads have started to widen once again as demand for higher quality fines. The government has previously had tight policies on financing in the property sector, but these are supposed to soften in the near term to support the industry. A curtailment of Brazil exports could support prices, but Australian exports were strong in January. We expect the majority of trading to take place between $70/t-$95/t and spreads for higher quality fines to remain strong.
Gold
Investment appetite remained elevated as the novel coronavirus impacted global financial markets. Global ETF inflows saw the biggest increase since September 2019 while CFTC non-commercial fell as investors had to sell to meet margin calls. Global panic has subsided; however, global uncertainty prevails in Q2 2020. A stronger dollar and subdued inflation, however, would cap the prices and we expect the prices to remain on-trend towards. As risk appetite starts to improve gold may correct to the downside, but with high debt levels across the globe and deteriorating economic data, we expect gold to trend higher through to $1,800/oz.
Silver
Increased physical and speculative demand has helped the precious to recover from the selloff seen in March. Subdued economic activity along with implemented lockdown measures dampened industrial demand for silver. In Q2, the outlook for silver remains positive attributed in part to positive spill-overs from gains in gold. Jewellery demand is to remain subdued on the back of consumer uncertainty. Range: $14/oz - $17.50/oz.
Palladium
In Q1, one of the best-performing commodities of 2019 tumbled to September lows along with other precious metals. Continued power outages in South Africa and mine closures globally helped palladium find support at $1,500/oz, resulting in a 21% rally. While we see some recoveries in the automotive sector in China, Europe and the US will lag behind. Similarly, we see industrial demand for palladium subdued, but fundamentals remain strong with the majority of trading taking place between $1,700- $2,500/oz.
Platinum
Demand for platinum is likely to remain subdued, at least for H1 2020, as the impact of coronavirus will continue to add pressures on manufacturers and automakers. We believe that industrial demand might take longer to re-stabilise as global supply chains recovery is seen beyond the second quarter. However, the outlook for platinum remains to the upside as it holds on to its safe-haven properties. Range: $666.50/oz - $895/oz.
Market Overview
Global Outlook
The spread of the COVID-19 affected global markets significantly in the first quarter of 2020. Equities suffered, and government bond yields fell as the coronavirus spread forced nations into lockdown to try to contain the outbreak. Precious metals, however, did not hold up to their safe-haven qualities and saw massive selloffs in March as investors had to free up cash to cover margin calls. Aside from interest rate cuts, central banks' (CB) balance sheets are now expanding at a record pace as they inject liquidity into the financial system to mitigate the risk of credit-liquidity crunch. Additionally, the Federal Reserve promised to supply dollars to other central banks to ease the threat of a global dollar funding squeeze. The worst performers so far have been the emerging markets, where rising bond yields, in economies such as Brazil and Russia, have tightened financing conditions and the stronger dollar added further headwinds to emerging market growth. In commodities, base metals and energy plunged as the spread of the virus worsened the outlook for demand. While, in theory, the agreement to constrain supply between oil-producing countries should support the prices, we believe that dormant demand and high inventory levels would keep prices low in Q2, unless we see further output cuts.
Western Economy Interest Rates
Many Western Economies have cut down interest rates in order to stimulate economic growth.

IMF forecasts world economic activity to contract sharply by 3% in 2020 with US GDP down by 5.9%, the euro area down by 7.4% and the UK down by 6.5%. China's recovery in Q2 2020 will be curtailed by the slowdown everywhere else in the world, yet will post positive growth in 2020 at 1.2%. On the assumption of the crisis being contained in H2 2020, we see recovery in growth as spending increases, inventories are rebuilt, and policy stimulus supports economic indicators. On the other hand, headwinds prevail as massive job losses, commodity and energy price shocks, along with damaged supply chains, will continue to amplify the depth of the virus impact.
The main theme of the upcoming quarter is the path to economic recovery. As May comes around, we expect to see more announcements on how the economies are planning to reopen once the virus is suppressed. The steps that the governments implement will largely depend very much on how the pandemic evolves in each nation. Therefore, in the most likely scenario, the pandemic peaks in various regions will differ in time and magnitude. This would suggest that a full recovery in global supply chains might extend out beyond the second quarter. The efficient use of testing kits and social distancing remain integral in this transition.
Oil markets have been one of the most impacted, and on April 13, Saudi Arabia and Russia struck a deal with other major oil-producing nations to slash production as they attempt to stabilise prices that have been upended by the outbreak of the virus. Members of OPEC, including Russia and Mexico, agreed to cut production by 9.7m b/d in May and June, the deepest cut in history. The drop came after Saudi and Russia abandoned their plans to cut production and engaged in a price war, that caused prices to fall by 66% in Q1.
Evidence suggests that this deal to cut supply is not big enough, and it is inevitable that more cuts are required to match weak demand. Once developed economies see a recovery in manufacturing and the overall reduction of travel restrictions, we would expect to see some substantial recoveries in the energy industry. In April, WTI prices plunged into negative territory for the first time. This compounded heavy losses for investors betting on an early recovery in consumption. Oil demand has fallen due to the global spread of the pandemic, resulting in WTI dropping from $63/brl in January to -$40.32/brl by the end of April – as the lack of storage and overall oil surplus urged producers to sell. We believe that in the upcoming months, further downward pressures prevail for WTI as US oil storage capacity is almost exhausted. However, Baker Hughes rig counts are falling in response to low prices, and we expect volatility to remain high in Q2.
Global Manufacturing PMIs
March saw major declines in global manufacturing activity, with China showing signs of a rebound.

The performance of global manufacturing activity surprisingly improved in March, to 47.6 from 47.1 in February, mainly attributed to the pickup of activity in China. From the service side, global PMI fell from 47.1 to 37.0 in March, suggesting services across the world are taking a bigger hit. Everywhere else in the world, activity declined to a catastrophic degree.
In the US, both services and manufacturing activity declined sharply, to 27.0 and 36.9 in April, respectively. Downturns in output and new orders led the overall decline in manufacturing, indicated the rate of contraction exceeding that seen during the financial crisis of 2009. Additionally, factories shut down and laid off staff which led to a solid fall in employment and business confidence. We anticipate the May numbers to remain subdued even if the country ends the "stay-at-home" regime for the nation. In Q2, the impact of COVID-19 should hamper investment and infrastructure projects, delaying a smooth transition back to normal levels. However, a well-timed and coordinated policy response of sufficient scale could limit the extent of economic disruption.
In the EU, the decline in manufacturing was even worse, with Germany’s numbers at 34.4. The Eurozone manufacturing PMI declined to 33.6 in April from 44.5 a month before. According to Markit, manufacturers continued to face obstacles in securing supplies, both from within and outside the bloc. Waning demand, along with heavy job losses and shortage of inputs, will continue to add pressures on the manufacturing industry. PMIs may see upward pressures from partial lockdown alleviation, activity levels are likely to remain depressed for the majority of 2020.
US
US: After a record-long bull market, the outbreak of COVID-19 is driving changes to the US economy to the point where forecasting becomes challenging. By the end of 2019, we saw economic growth in line with the base case expectation, and now are contemplating the extent of the upcoming recession. The scope of the government's containment measures implies a technical recession; Q1 GDP reached -4.8% y/y, and negative growth in Q2 is feasible. As of March 31, the S&P 500 Index is down 23% from its 2020 peak, however, smaller losses than last seen during the financial crisis. While equities have priced in some of the risks, more economic pain is still in place for the year ahead.
US Debt to GDP vs Spot gold vs S&P Volatility Index
Gold is trading close to January 2013 highs as equity volatility remains at record highs.
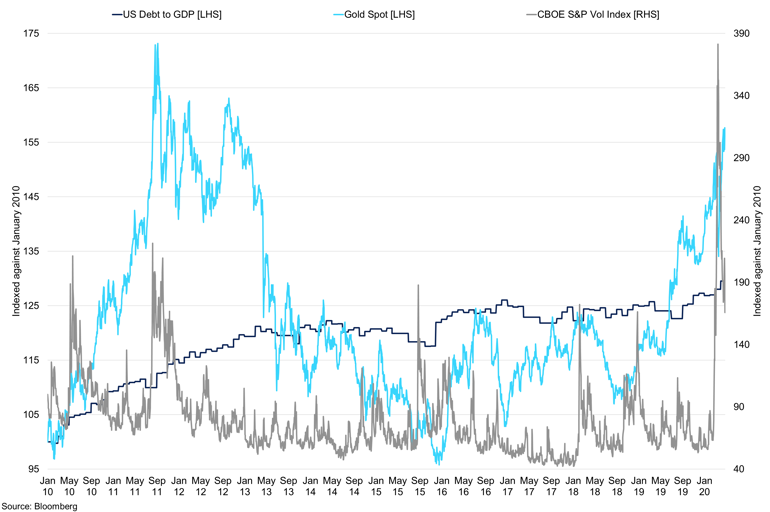
Large stimulus measures will be crucial in offsetting the credit-liquidity crunch and subsequent recession. Tailwinds from the monetary and fiscal policy should eventually promote stronger economic conditions when the virus disruption has cleared. In the March-April period, the Fed released an array of rescue packages, including the CARES Act, worth $2.2tr and additional aid worth $2.3tr to ease some of the economic pain felt during the pandemic. The largest in history CARES Act package was designed to help target liquidity to people, and companies harmed explicitly by the pandemic. Billions of dollars will be directed to households, small businesses, and state and local governments to help ease the financial burden as a result of a sudden stop of economic activity.
Overall, Trump remains enthusiastic about restarting the economy and has pressed staff to expedite planning for the economic recovery. Officials are considering segregating the regions into "red and green zones" to designate where the government believes it's safe to reopen. The main caveat behind all of the suggested strategies is the lack of accurate testing. This will allow for those who contracted the virus, especially the asymptomatic cases, to be isolated, and those that were previously-infected, to go back to work. However, more US states are beginning to lift lockdown orders despite public health experts warning that doing this too soon could cause a second wave of infections.
In the economy, we have seen some major red flags that could trigger a recession in 2020. Over 30m Americans filed for unemployment benefits in the six weeks ending on April 30. As lockdown measures have been implemented across the states, more workers have been laid off across industries. The three-week data implies an unemployment rate approaching 15%, well above the 10% peak reached in the wake of the last recession. We believe the filings will likely stay elevated in Q2 2020.
US CPI vs Real Average Weekly Earnings vs Jobless Claims
The inflation is trending lower as more Americans file for unemployment benefits.

Additionally, some 'labour hoarding' could take place, where employers choose to keep staff on the payroll even if there isn't any work. This, however, would not apply to restaurants, bars, and other businesses that can't hoard labour, and therefore, a stimulus package would be essential to sustain these service-based businesses. Indeed, we do not anticipate a surge in labour employment in 2020 attributing this to massive losses in small business activity.
By the end of Q1, equities have come off of their worst slump since the Financial Crisis on the back of easing worries about the fallout from the pandemic. While we are already seeing some recoveries in the first weeks of April, the larger problem remains in the corporate debt markets, especially for those companies with lower credit ratings. While the Fed has provided billions of dollars to ensure the liquidity of credit, we are of the opinion that the number of defaults will likely rise in 2020. Additionally, credit spread widening could attribute to a higher cost of capital that small businesses will find more challenging to finance.
The uncertain economic environment has certainly daunted on an American consumer. As fear builds up amongst Americans, they reserve to the easiest way to access cash – through the equity of their homes. Indeed, the share of loans in forbearance (temporary postponement of mortgage payments) jumped to 6.99% on April 19, up from 5.95% a week prior following the passage of the CARES Act. Home loans issued to riskier borrowers also jumped to 5.89%, up 1.58 percentage points.
We see consumer spending subside in Q2 2020, despite a spike in essential shopping, as car dealerships, furniture and other big item stores suffer from a lack of traffic. According to Deloitte, real consumer spending will fall to -4.7% y/y in 2020, from 2.6% in 2019. The steep decline in travel, leisure, and hospitality should push demand and GDP into a tailspin. In March, the retail sales suffered the biggest plunge in history, dropping as much as 8.7%, as the pandemic shuts the stores.
Eurozone
Eurozone equities declined sharply in Q1 2020, as Italy and Spain became some of the most severely impacted countries in the world. Nations across Europe took steps to constrain movement nationally as well as across the bloc. Growth in Europe remains fragile, as it expanded marginally by 0.1% in Q4 2019. Eurozone’s GDP growth for Q1 contracted sharply by 3.8%, in-line with other economies across the world.
Europe Manufacturing PMI and Construction
Eurozone manufacturing and construction activity reach record lows on the back of the pandemic fuelling a global economic crisis.

Current indicators do not paint a favourable picture for the quarter ahead. The manufacturing performance has taken a hit as Markit PMI declined from 44.5 in March to 33.6 in April, a record low. All sectors across Europe fell, with exemptions in healthcare and utilities. While Germany is in a much better state to weather the consequences of the outbreak, Italy, Spain and others will require much more financial support and time for recovery. In Germany, Europe's manufacturing capital, the 2020 growth is forecast to fall by 2.8% y/y in the best-case scenario and 5.5% in the worst-case one. For 2021, however, analysts expect a speedy recovery, with a V-shape recession curve and a surge in labour force once the economy returns back to normal. In the end, it is the duration of the lockdown that will be the most decisive factor in the speed of economic recovery.
European Economies Bond Yields vs the US
Italian yields rose in April as concerns grow over the country’s ability to deal with the economic pain from the pandemic.

To support the economy, the ECB committed to net asset purchases of $130bn in addition to the Pandemic Emergency Purchase Programme worth $845bn that will fund the purchase of government and corporate bonds until the end of the crisis. The ECB left the deposit rate unchanged at historic lows of -0.500% and kept its marginal lending facility at 0.25%. Instead, it removed most of the bond-buying limits in its pandemic emergency programme to help contain financial fallout during the period of disruption. To protect the labour market, the EU Commission has put forward the Support mitigating Unemployment Risks in Emergency, which would free up to EUR100bn in loans to EU members to protect jobs. On the other hand, allowing ECB to buy nearly unlimited quantities of the nation's sovereign debt, could push down bond yields making fiscal stimulus harder to finance. Indeed, according to the European Network for Economic and Fiscal Policy Research, curbing the outbreak could cost the EU up to $544bn.
The Bank of England reduced its policy rate twice this year, bringing it down to 0.1% from 0.75% at the beginning of 2020. The bank said it would also increase its holdings of UK government and corporate bonds by £238bn with an effort of lowering the borrowing costs. In the Budget, the Chancellor promised to provide public services with whatever resources prove to be necessary, with initial funds of £12bn made available. This comes at the time when the GDP growth is forecast to fall by 6.5% in 2020, before recovering by 4.0% in 2021.
China
China was the first country to be exposed to the COVID-19 pandemic, and have since re-emerged from lockdown. Many are now looking at their experience to understand what might occur in Europe and the US. Traffic congestion in Beijing and Shanghai is returning to normal levels, and coal consumption is trending higher. While the Chinese business sector has mostly reopened by the beginning of April, export-reliant factories and firms have been hit by a slump in demand from overseas customers.
In Q1, fixed asset investment dropped by 16.1%, trade volume declined by 6.4%, with exports bearing the brunt of the 11.4% y/y decline. Retail sales saw a 19% reduction. The quick recovery in industrial production, however, shows that the supply shock was short-lived. We anticipate a slower market growth in Q2, before seeing a sizeable recovery in H2 2020.
Industrial Production vs Retail Sales vs Private Investment
China is seen bouncing back, however, the speed of such recovery will depend on the rest of the world.

During the outbreak of the virus, the government released an array of policy tools to help support the economy that shrank by 6.8% in Q1 2020. Local provinces announced infrastructure projects, and the PBOC has cut rates on the 7-day reverse repurchase agreements to 2.2%, yielding a total of 0.3% decrease in 2020. Additionally, the PBOC lowered bank reserve requirements ratio by 1.5 percentage points, freeing up around $135bn into the economy and set a higher cap on foreign debt to attract investment. China has also agreed to increase its fiscal deficit as a share of GDP, issue special sovereign debt and allow local governments to sell more infrastructure bonds. The biggest downside risk to economic recovery remains the size and scope of the introduced measures. While lower interest rates and injection of liquidity should support the economy, small and medium-sized businesses remain unprotected.
As ballooning unemployment threatens social instability, a sizeable fiscal stimulus package would be paramount to China’s recovery. Measures implemented so far are much more limited than in other parts of the world. However, proactive fiscal policy measures such as tax cuts for affected regions and sectors, RMB4-5tr and RMB2tr of local and special government bond issuance, as well as support for new infrastructure investment.
In March, China and the US have joined hands in combating the pandemic and continued to work on a trade deal to alleviate the pressures on the flow of goods. In April, however, the president himself threatened to terminate said the deal as he insinuated that Beijing might have caused the coronavirus pandemic internationally. China continues to purchase agricultural products from the US after it removed some of the restrictions on foreign companies in its financial markets. In Q1, China imports of soybeans and pork skyrocketed 100% and 600% y/y respectively. Overall, Chinese exports to the US fell 23.6%, with imports down 1.3%. In Q2, with trade escalations at hand, we believe that a trade deal is a long way off.
Emerging Markets
Emerging market equities fell heavily in Q1. The spread of COVID-19 beyond China led to global lockdowns and significant declines in economic activity. A stronger dollar was an additional headwind for emerging markets. Constraint capital inflows and insufficient safety net funds are putting further pressure on economic conditions in emerging markets. The MSCI EM decreased by 23.6% in Q1, comparing to a 21% drop in MSCI World, highlighting the severity of the economic detriment to those vulnerable countries. The quarter ended with some recoveries on the back of global central bank stimulus measures.
In India, exports shrunk 34.5% in March, the steepest monthly fall in 25 years. IHS PMI for services fell from 57.5 in February to 49.3 in March, and economic growth is projected to grow at 1.9%. As a countermeasure, the Indian government announced a $22.6bn stimulus plan to aid poorer communities affected. The government is now looking at various options to help businesses.
Emerging Market Currencies
In Q1, the US dollar surge was supported by its safe-haven status, driving several EM currencies to record lows.

Brazil was the weakest market, with the BRL down 23% in the quarter, a record drop. The central bank has cut interest rate twice by a total of 75bps. Additional measures, including a $10bn scheme, should allow companies affected to reduce salaries and hours, or temporarily suspend contracts, to preserve employment. To protect the currency, the BCB agreed on a foreign exchange swap line with the Fed. The effectiveness of such intervention, however, remains limited when looking at the market response to the previous attempts.
The pandemic has hit various regions of the world differently. Indeed, Russia implemented a strict '100m rule' regime which does not allow you to travel more than 100m from your home. Mexico, on the other hand, refused to close businesses and implement quarantine until mid-March. In emerging economies, especially, it is going to be more difficult to control people, and the strain on the healthcare system could prove to be challenging.
Aluminium
Summary
Summary: Construction has been hit in Europe and the U.S., particularly in the U.S. where shipments of extrusions declined 5.9% y/y in February. Alumina prices have been falling significantly, and this could cause a response from the supply side. Indeed, despite some smelters suspending production, we may need to see more to support prices on the LME. Demand was weak in 2019, and this has been compounded in 2020. We expect prices to remain on the back foot in Q2, but assets may benefit from a risk relief rally if economies start to re-open.
Q1 Review
Aluminium prices have remained under huge pressure in Q1 as investor sentiment was decimated due to the global pandemic. Prices fell by 15.43% to $1,486/t; however, prices fell approximately 9% in March alone as the virus captivated the rest of the world and lockdowns were enforced across the world. Already weak consumption for aluminium worsened due to the virus, however, production of primary aluminium remained relatively steady in China despite the New Year and the virus. This has given rise to LME inventories, which now stand at 1.21m tonnes.
LME vs SHFE Stocks
Chinese exchange inventories increased sharply in Q1, due to lack of physical demand.

The virus has spiralled the global economy into a recession, causing significant stimulus from central banks and fiscal policy from governments. The supportive measures will help mitigate some of the impacts of the virus, but we expect there to be more stimulus needed. Consumption has been hit as automobile factories close and construction has ground to a halt. The recent stimulus packages have buoyed sentiment in the markets, but we expect prices to remain on the back foot. One bright spot for prices, but not for health is that the virus has spread to producing countries which is expected to reduce supply in the coming year.
Outlook
The recent decline in prices on the LME has had significant impacts on production around the world. Demand was weak in 2019, and the market was talking of production cuts to help support prices, however now we do not think current production cuts will be enough to support prices. Demand looks set to contract in 2020 as the automobile and construction take a hit from the coronavirus in H1 and the global economy goes into recession. Auto sales and production in China fell 80% y/y in January and February 2020. We expect m/m figures to show recovery however we expect this data will be misleading and the year-on-year figure will be a better barometer for sales. March vehicle sales were down 43.3% y/y, according to the China Association of Automobile Manufacturing (CAAM). This brings auto sales for the first three months of 2020 down 45.4% to 2.9m units. Indeed, IHS Markit has estimated that production in China of light vehicles will fall 11.5% to 21.6m units, which comes after the CAAM predicted a decline of 5% in total auto sales in 2020 in China. European-27 car sales dropped 7% y/y in February before the full impacts of the virus had set in; we expect this to fall significantly in March and April. Indeed preliminary data for Western Europe suggested SUV sales are down 50% y/y. We expect U.S. sales to be equally as weak, with March sales figures suggesting a decline of 40%, but in our opinion, we will see these figures fall further in April.
Global Auto Market
The auto industry has been one of the worst-hit by the virus, recovery will not be instant.

European car producers have implemented output suspensions as a form of virus containment and response to weak demand conditions; output for aluminium products such as sheet and castings. The same is the case in the U.S., where aluminium demand is skewed towards auto production. End-user companies have been de-stocking but castings, rollers and extruders are expected to face downside in the immediate term. Novelis in both the U.S. and Europe have cut back production, and Constellium has curtailed production of the auto sheet. According to Wood Mackenzie, approximately 500,000 tonnes of production of the auto sheet has been suspended in Europe. In addition to the Novelis cutbacks which could be 400,000 a year, Alcoa suspended 120,000 tonnes of car body output. Alcoa has cut plans for $100m of CAPEX and deferred $220m in pension contributions and also cut output at the remaining uncompetitive smelters (230,000 tonnes) by the end of July. Another automotive sheet plant in Lewisport has reduced output; the plant produces 220,000 tonnes. New orders have fallen, and we expect that to remain the case in the immediate term, however, if new orders for May and June remain weak, we expect more plants to curtail production. In the U.S., especially, aluminium content in vehicles has been increasing. According to the Aluminium Transportation Group (ATG), aluminium content in vehicles will increase from 180kg in 2015 to 256kg by 2028. Aluminium will make up 16% of the vehicle’s total weight. Before coronavirus, North American vehicles in 2020 were expected to consume about 4bn kg. In 2020, aluminium content in autos is expected to be 211kg as it has been supported by the increase in aluminium content in car bonnets which has risen 21% as of 2020.
China Industrial Output - Primary Aluminium vs Exports of Unwrought & Aluminium Products
Aluminium output has remained relatively constant despite COVID-19 and smelter suspensions.

Supply has started to react to falling demand. According to the International Aluminium Institute, global production improved in March from 5.112m tonnes in February to 5,477m tonnes, with Chinese production at 3,100m tonnes, down from 2.879m tonnes the previous month. Exports of unwrought aluminium & aluminium products were 518,590 tonnes in March, up from 480,000 tonnes in February 2020. Total exports for aluminium for the first three months equals 1.19m tonnes. According to the National Bureau of Statistics (NBS) output for aluminium products were 590,600 & 461,500 tonnes for February and March respectively; electrolysed aluminium production was 584,700 tonnes. All of the above were down year-on-year, and we expect year-on-year figures to remain weak in the near term as the economy starts to recover. The decline in prices caused over 50% of Chinese production to lose money, and we have seen Chinese smelter capacity reduce due to maintenance and loss of earnings. Chinese smelter capacity has fallen nearly 700,000 tonnes; we also saw world ex-china production down 4.2% y/y. According to SMM, Hydro has halted large amounts of capacity extruded solutions are increasingly running at a lower capacity. 30% of sites are running at 45% capacity, with 25% of plants closed completely. Trevali, Lundin, and Nexa have all seen production halted. The latter Nexa has suspended all mines in Peru due to government policy, the Cajamarquilla smelter has reduced capacity and the utilisation rate to 50%.
Aluminium Premiums
US Mid-West premium exemplifies weak consumption in the aluminium market.

Alumina prices have been in free fall in recent months, spot prices have fallen with Australia alumina FOB trading at $225/t as of April 14th. The smelter cutbacks have softened demand for alumina in the near term, but more cutbacks may be needed to counteract weak primary aluminium demand which is expected to decline 3% in 2020. We expect spot prices for alumina to fall in the coming months; in China, there is little appetite for imported alumina due to the domestic surplus. Alumina imported trades at RMB2, 075/t as of April 14th with average domestic prices at RMB2, 073/t. Spreads are in contango, and we expect this to remain the case, the fund short keeps the momentum on the downside. We could see prices rally as cases start to fall, but we do not expect demand to recover in 2020, keeping momentum on the downside.
Copper
Summary
Indeed, the cash to 3-month spread highlights the weak demand situation, and this is expected to continue in the long run. Supply-side disruptions could help prices gain momentum on the upside, but we expect gains to be sold into. The scrap market is expected to be quiet in 2020, with estimates suggesting the market fell by 225,083 in Q1 2020. Reduction in scrap supply may support cathode demand. Improving utilisation rates at smelters will improve copper products output in China, this will be capped by maintenance at smelters.
Q1 Review
Copper prices declined 20% in Q1, the market was well supported at $5,500/t in February, but as the virus spread across the globe, copper prices stormed through $5,000/t. The market was supported below $4,500/t. Rising inventories compounded losses as demand in China and other major economies fell off a cliff. Manufacturing PMIs fell sharply in February, and China’s industrial production may be negative for the first time on record in Q1 2020. The lockdown has spread across the globe, and this will impact manufacturing PMIs in the medium term. Investors would do well to remember these data points are reactive, but we do expect copper demand to be muted in the long run.
China Macro Indicators
Lockdown procedures had significant impacts on the Chinese economy. Recovery will take time.

While retail sales will be supported by panic buying at supermarket stores; preliminary data suggests food sales, home entertainment, and DIY sales have surged higher, but this will not support demand for copper. Demand worries remain significant, but we could see some supply taken off as low prices wipe out profits.
Outlook
The coronavirus prompted the global economy to slow down, and the chance of a recession is very high. With China now returning back to full capacity, demand for copper has started to improve, manufacturing and construction sectors will improve downstream demand. End-user demand may remain muted in the long run due to loss of earnings. According to the Chinese government, 95% of companies with annual revenues above 20m yuan had resumed production by the beginning of April. Production of air conditioners was down 27.9% y/y in March at 19.4m units, bringing the total number for 2020 to 36.9m units. Washing machine output was 6.4m units in March up 0.5% y/y, production of refrigerators were 7.3m units in March, up 4% y/y. March data suggests that output of end-user goods is improving, and in turn copper demand. In keeping with the improvement in-home appliance output, China’s copper downstream PMI expanded in March at 51.55. The index covers electronics, transport, and home appliance industry and increased from 37.97 February. The production index also increased to 53.07 in March, new orders also improved to 52.83.
Copper Operation Rates

This is mirrored in operating rates data from SMM, which shows copper smelting and refinery operating rates rebounded in March to 90.75% from 88.86% in February. Operating rates for copper wire producers in April was 80.01%, significantly higher than February’s rates of 34.68%. Rod producers total operating rates are comparatively lower at 64.4% in April, up from 60% in March. Copper tube producers have rebounded strongly in March and April to 75.73% and 86.74% respectively. We expect operating rates to be near edge higher towards 95% that we saw in June 2019. However, despite the marginal improvement in copper consumption in the near term, on a historical basis, copper demand is expected to contract in 2020 by 3.6%, refined consumption by 3.1%.
The recent stimulus packages from governments will help support economies, however, the funds are expected to prevent the worst-case scenario rather than generate pro-longed economic growth. China has started targeting infrastructure as outlined in previous reports. In Q1 special-purpose bonds issued by local governments exceeded 1trn yuan, up 63% vs the same period in 2019. Of this allocation, infrastructure accounted for 85% of the issuances, which should support demand for raw materials. 5G is expected to be a large focus of support as well as, inter-city transport and railway, AI and electric vehicle infrastructure. Ultra-high voltage projects are expected to support the economy however, we do not believe this will improve copper demand as the cables are steel-reinforced aluminium conductors. China’s State Grid investment has increased investment on the electricity network this year by 10% to 450bn yuan, with ultra-high voltage projects accounting for 40.24% of this investment. This is the first year investment has increased for three years.
Copper Premiums
Copper premiums showed signs of improvement in April as the Chinese economy recovered.

The initial impact of the virus was on-demand, and while this is still true as China starts returns to full capacity and countries look to ease lockdowns, the supply side has started to take centre stage. Latin America and Africa are behind Europe and the U.S., and we have seen prices supported by mine suspension in April. Major copper producers such as Codelco, BHP, Glencore, Anglo American, Freeport-McMoran, and Antofagasta have all suspended or reduced operating rates. Some of these suspensions have been enforced by government lockdowns, but others are attempting to keep production running but at the significantly lower rate. As governments attempt to ‘flatten the curve’ of the coronavirus we expect supply to start to improve, however, we do expect the virus to have a greater impact in regions such as Africa and Latin America due to poorer healthcare systems and a greater proportion of citizens living in close proximity and unable to conform with social distancing rules.
Imports of concentrate and ores for March 2020 were 1.78m tonnes in March, YTD imported volume reached 5.55m tonnes. We have seen TCRCs fall in recent weeks, and we expect this to continue in the near term. The SMM copper concentrate index fell to the week April 24th to $57/t. The China copper concentrate TC 25% CIF stands at $59.50/t as of April 27th. This is due to weaker demand from smelters, however, utilisation rates have improved in recent weeks, suggesting they have managed to alleviate the high levels of sulphuric inventories. Sulphuric acid stock levels caused smelters to reduce production in Q1. We expect smelter production to start to improve towards the end of May as maintenance starts to come to an end. However, some company’s maintenance period is expected to be longer than usual due to weak end-user demand.
China Copper Output Data
Copper products and refined copper output declined marginally in February, but we expect this to recover.

According to customs, China’s imports of unwrought copper and copper products were 441,926 tonnes for March 2020. Refined copper production was 771,000 tonnes in March, down 2.5% y/y according to the NBS. With smelter utilisation rates starting to improve we expect China production to improve m/m in April but these gains may start to tapper due to maintenance at smelters. Exports from China were 93,889 tonnes as of March 2020. The key figures will be from the supply side in the coming months; this could present some upside to markets if we see mines at reduced capacity for significant periods of time. Indeed, the cash to 3-month spread highlights the weak demand situation, and this is expected to continue in the long run. Supply-side disruptions could help prices gain momentum on the upside, but we expect gains to be sold into. The scrap market is expected to be quiet in 2020, with estimates suggesting the market fell by 225,083 in Q1 2020. Imports of copper content with an average of 78.49% were 176,676 tonnes, according to SMM imported copper scrap accounts for 60% of copper scrap consumption in China. The allowance for Q2 was 224,200 tonnes of copper scrap.
Chinese Copper Ore Imports vs Scrap
Copper ore imports were 441,926 tonnes for March, but scrap imports remain low.

Lead
Summary
Lead demand from the automotive industry has been poor so far this year; we expect this to remain the case in Q2. YTD vehicle production in China is 3.474m; passenger cars make up 2.68m units. Passenger car production has started to improve after February’s disastrous figure of 195,176 units. Battery output has also been weak. We expect supply suspensions due to the virus, but the lack of demand will cap gains. Indeed, when mines come back online, we believe prices will have another leg lower as consumption remains subdued.
Q1 Review
Lead prices weakened in Q1 by 9.25%, losing 5.10% in March alone. Coming off the back of weak performance in Q4 2019, the sentiment was already on the back foot. Poor sales figures for cars across the globe in 2019, in conjunction with a mild winter, dampened lead consumption. Any demand has been wiped out by the virus, with some car manufacturers closing their factories. Indeed, with lockdowns in full force, civilian car use has been significantly reduced. However, if cars are left unused for too long, this will increase the probability of battery failures.
Cash to 3-month spread vs LME 3-month Price
Falling lead prices and a spread in contango outlines weak fundamentals.

Spreads tightened significantly in February to $67.50/t backwardation but as the virus spread globally, the spread switch to contango and closed the quarter at $7.79/t contango. Exchange inventories have been very steady this year, with daily changes muted. We did see some inflows into LME warehouses in March; these inflows were in European warehouses. SHFE inventories have fallen sharply though, a decline of 68.65% to 13,969 tonnes, limiting SHFE front-month contract losses to 5.95% in the Q1.
Outlook
Lead supply has been limited by the suspension of mines due to the virus, similar to zinc. Peru and Bolivian production have been halted due to government policy; it is unclear when these restrictions will be lifted. At the time of writing, they are expected to be extended as the lockdown continues. In 2019 the combined output of the idled mines in Bolivia and Peru was about 350,000 tonnes. Mexican lead production has also been suspended, which equated to 250,000 tonnes in 2019. We expect mine production to try and run at reduced capacity if the lockdown continues in the long run and companies to employ the A & B structure where possible. We have started to see a response from mines in China, where production has restarted. Stated owned enterprises started bringing their mines back online in mid-march. However, mines in the Xinjiang province resumed capacity in mid-April. There was a staggered approach to bringing output back online, however, we do not envisage this was planned. In our opinion, we will see more Chinese mine supply come back online in the coming months. This will be offset by the loss of mine production outside China.
China Battery Operation Rates
Operation rates improving but we there is little demand from the auto sector at this time.

The loss of mine supply will cut likely prompt a decline in concentrate inventories, Wood Mackenzie suggests that we could see global mine supply fall by 8.2% to 4.36m tonnes. Indeed, Chinese production will fall to 1.99m tonnes according to Wood Mackenzie. We see some shipping delays for commodities at ports, and this will delay deliveries in the medium term. The thin workforce and the need for workers to isolate and be tested will be a drag. Spot TCs are already falling in conjunction with stocks, we continue to see Chinese demand improving, and TCs of imported concentrate was at $140/t as of May 1st. Domestic TCs have also been falling and averaged RMB2, 150/t as of May 1st, the domestic TCs range from RMB2,300/t in Inner Mongolia to RMB2,000/t in Hunan, Guangxi and Yunnan. According to NBS, refined production was down 6.4% y/y to 1.19m tonnes for the first three months of 2020. Output was 454,000 for the primary lead, but we expect primary lead production to increase on an m/m basis. Medium-sized operating rates were 38.58%, with large-sized producers were 64.68% both for February. We expect these to increase in April and May, bringing primary lead production towards normal levels. However, falling prices and at the time of the writing comparatively high TCs may trigger some mines to close. Smelters are well covered for concentrate, and this could keep TCs supported, however, the fall in mine production will impact profitability in the long run. Secondary lead has been hampered by logistics and is taking longer to recover than primary production. According to SMM, secondary lead production to the lead ingot supply has exceeded 40%. Secondary output has surged under the more environmentally focused rhetoric.
German Mfg and Industrial Market
German manufacturing and industrial data outline the weak European market.

Demand for lead is expected to remain under pressure due to the weak auto industry data. China auto production will come back online first but remains low on a historical level. Batteries contribute to 75% of lead demand, YTD vehicle production in China is 3.474m, passenger cars make up 2.68m units. Passenger car production has started to improve after February’s disastrous figure of 195,176 units. We expect production to start to increase back towards a normal level around 2m units. Commercial unit output also declined, falling to 89,361 units in February. We expect vehicle production in the U.S. and Europe to remain weak in the near term. IPSOS data shows that after coronavirus, there is a move by Chinese citizens towards private vehicles. Indeed, in a survey, 66% of respondents said they would use private car vs 34% before the virus. Before the virus, 56% of respondents would use a bus or metro, but this has fallen to 24% after the virus. Indeed, car-hailing and taxi use have fallen since the virus, to 19% and 12% respectively, down from 21% for both before the virus.
LME Lead Warehouse Stocks vs SHFE Deliverable Stocks
SHFE stocks have been more volatile than the LME.

Starter replacement batteries in the U.S. declined to 8.405m in January 2020, however, this seems to be a seasonal norm for January. We do not expect to see replacement batteries increase in February, March or April as auto use declines during the lockdown. NBS data suggests battery production was 203m kVAh in 2019, up 4% y/y. We do not expect this strength to be carried into 2020. The utilisation rates for battery plants was 30% in February, with one of the largest producers running at 80% capacity output is expected to remain weak in the medium term. Exports for the first two months of the year reached 2.18m tonnes in the first two months of the year down 11.5% y/y. The bright spot for lead remains energy storage. According to Wood Mackenzie, global wind turbine capacity increased by 100 GW in 2019. China was accountable for half of this capacity; this is expected to be a boon for lead demand as batteries are predominately used in these batteries.
Nickel
Summary
Nickel prices managed to hold their nerve compared to other base metals. The lack of Indonesian ore has been offset by weak demand for stainless in Q1. The virus has caused some capacity to be idled, and this could provide support for prices if they continue. However, stainless inventories in China are high, but the lack of ore could prompt NPI production to fall. EV sales have been weak, but we expect sales to start improving in the coming months. Inventories have been rising, which will cap gains on the upside.
Q1 Review
Nickel prices declined by 18.61% in Q1, bringing price action from the start of January 2019 to +7%; a far cry from last year’s peak. The virus compounded demand fears for stainless steel. While we expect nickel consumption to be supported by stimulus measures from China, we do not believe China or other major economies for that matter will be able to support the economy as they have done previously. High debt to GDP ratios, already accommodative monetary policies and rising budget deficits present longer-term risks to economies. We expect the price recovery to be more U shaped.
Nickel Calendar Spreads
The wide contango down the curve is a stark contrast to Q4 2019.

Similar to the rest of the base metals complex, LME inventories have started to rise as demand falls but supply ticks along at a slow pace. LME stocks closed the quarter at 230,000 tonnes. Stocks have fallen in 2020 by 23.35% in SHFE warehouses. The cash to 3 months has widened to $50 contango as of April 4th, 2020. We do not expect the spread to tighten for fundamental reasons in the near term. Due to market volatility, system funds have gone into protective mode, and this could bring the market back to physical, however, liquidity in the market is a concern.
Outlook
As we moved into 2020, there was cause for optimism as Indonesia stopped nickel ore exports. However, Covid-19 has changed the outlook completely. We now expect a contraction of about 2m tonnes in global nickel demand for 2020. Government and central bank stimulus is expected to help economies, but in our opinion, the global economy will go into recession in 2020. We do not expect the recovery to be V-shaped, and this may keep demand muted into 2021 if the global stimulus measures are successful. Early earnings figures for Q1 suggest that data will be weak, and this could trigger reduced investment in the near term as companies hold cash. The uncertainty in the market will not help consumer confidence while we are seeing the retail economy, providing a green shoot during this isolation period. However, big-ticket items such as cars and household appliances like washing machines are likely to be held off until more certain times. Then when you factor in that nearly 20m U.S. citizens have lost their job in the last month, consumption in the U.S. alone will be softer. Auto sales figures are significantly weaker in Q1, and we expect this to remain the case in the near term. Chinese sales figures are negative y/y; in our opinion, the U.S. and Europe auto markets will weaken further in March to May. Vehicle sales in February globally were 4.138m units, down from 5.5m in January and capacity utilisation has started to fall in recent months across the globe.
Chinese Nickel Ore Imports vs Stainless Steel Production
Stainless production is starting to recover, which is friendly to nickel.

Stainless steel comprises just over 60% of nickel demand and Chinese based nickel stainless steel production tailed off significantly in January and February to 1.53m tonnes. However, February production figures have been around 1.53m tonnes since 2017. February output was a far cry from August 2019 production of 2.282m tonnes. Production at privately owned mills was 1.2m tonnes, and we expect March’s production to be marginally higher on an m/m basis but lower y/y. We continue to see downside revisions to stainless steel production for 2020, and this will be dictated by the speed at which mills will be able to get back to high operation rates in China. We anticipate nickel consumption to contract in 2020 as well, but at this time consumption could fall close to 2% as auto demand and stainless production are weak. European stainless, while a smaller percentage of the global capacity will also likely weaken in 2020, with output expected to be 6.69m tonnes. This could be amended in months to come if global stimulus packages start to improve underlying conditions.
Nickel Premiums
Premiums continue to trend lower.

New stainless capacity is likely to be delayed due to COVID-19; Mintal and Bishi have been deferred by a year. We have also seen mills delayed in Shandong, while the plants were expected to produce 200 series, lower nickel content stainless steel. These facilities are in addition to the MHJill expansion by Baowu Desheng and Zhongjin Metal both adding 1 Mtpa of capacity in 2021. These projects, in conjunction with idled capacity due to the virus, support the premise that nickel consumption will improve in 2021. In Indonesia, we could see similar large scale projects come online in 2021, Tsingshan still has 1mtpa of idle capacity, and we do not expect that come online in the near term as there are anti-dumping duties on Indonesian stainless and demand is soft. However, we see the global economy remaining on the back foot in the long term, which could act as a headwind to stainless steel consumption.
LME Nickel Inventory s vs Ni Ore Inventory at Seven Major Ports China
The drawdown in nickel ore stocks at ports suggests lack of seaborne supply.

From a supply perspective, refined nickel production is expected to improve this year. However, there is some downside to this as mines will be impacted by lack of labour due to COVID-19. We have seen some disruptions including, Norilsk Nickel, Vale, Newmont, Glencore, BHP Billiton, Sumitomo MM, Anglo American, South32, and Ifishdeco. Some mining operations were suspended due to maintenance, for example, Vale in Canada. Vale has invested in 5m testing kits for COVID-19 and has adopted thermal camera’s to identify symptoms on workers. We wait to hear if there are more suspensions announced and to see if these projects come back online. Total production losses due to the lockdown in the Philippines are about 90,000 tonnes, which has significantly impacted Filipino exports. The last time Indonesia banned ore exports the Philippines helped offset the loss of supply, however, we do not believe this is the case this time around, and their capacity to export 36m tonnes or nickel or is non-existent. We expect Chinese NPI to fall due to weak imports of nickel ore. Spot priced below $11,000/t threaten Chinese NPI production, as well as FeNi, produces. Nickel ore inventories are high, and we expect stocks to be withdrawn in 2020, and this could give rise to prices on the LME in H2 2020. Exchange inventories have risen in 2020 to 229,062 and 28,145 on the LME and SHFE exchange respectively. China nickel ore inventories have fallen this year from 1.135m tonnes in January to 825,200 as of April 15th 2020; laterite ore inventories have also declined from 7.690m tonnes in January to 5.570m tonnes, as of April 15th 2020.
Tin
Summary
Chinese customs data for tin shows that imports of unwrought tin and alloys surged higher in the first two months of 2020 to 1,771 tonnes. Demand remains weak, and the pre-virus semiconductor sales paint a grim outlook in the immediate term. Mine suspensions caused LME prices to rise as concentrate imports into China fall. The PHLX Semiconductor Sector Index rebounded from the recent lows, in unison with LME and equity indices. Weak consumption will likely cap gains on the upside.
Q1 Review
Tin prices lost 14.8% in Q1, however up to the March; prices were well supported at $16,000/t. In March prices declined 22.3% to the low at $12,950/t, and the market recovered to $14,602/t. Demand for solder and semiconductors has been hit by the virus. We did think consumption would improve this year following the decline in 2019 as a result of the trade war. However, this seems a distant memory now as COVID-19 has dominated price action, but it has become clear that tensions between the U.S and China have escalated, and a deal looks less likely now. Nonetheless, with both economies struggling this could increase the probability of a deal.
Calendar Spreads
Tin spreads are backwardated but have eased in recent weeks.

LME inventories declined 12% in Q1 to 6,245 tonnes; we saw a big inflow material in the first few days of April. With consumption lacklustre, we do not believe there will be decline inventories in the near term unless we see supply-side constraints and a reduction in refined production. SHFE deliverable stocks declined 17% in Q1, however, this does not tell the full story as inventory increased to 7,000 tonnes before declining in March to 4,439 tonnes. Tin prices on SHFE declined 13% in Q1.
Outlook
The PHLX Semiconductor Sector Index mirrored stocks and weakened 19.45% in Q1. However, the index found support since testing appetite around 1200 and corrected 29.5% since reaching the current bottom in March. The index is a weighted comparison of companies that are involved in the semiconductor supply chain. The index performed well over 2019 despite the challenging macro environment between China and the U.S., as equity indices continued to be supported by share buy-backs and low-interest rates. The recent sell-off in the index has brought the P/E ratio back towards 2017 levels, to 23.02. The yearly estimate is expected to be lower still with the P/E ratio falling to 18.70 and 15.19. Indeed, sales per share for those involved in the index have been flat since 2018; 345.3 and 349.9 in 2018 and 2019 respectively. Current sales are 348.82 with a gross margin percentage at 52.48% so far in 2020, marginally lower than the last two years. The earnings for Q1 yet to be released but COVID-19 has caused significant damage to supply chains, company earnings and demand alike, suggesting that earnings will be weak. The market is expecting this and will hope that recent fiscal and monetary stimulus will buoy the market in the coming months to help improve the global economy.
China Solar Power
Solar power output has increased sharply despite solar output growth falling y/y.

Our previous report outlined that we expected solder, and by proxy semiconductor demand to improve in 2020. This was before the coronavirus caused citizens to retreat inside under government policy. We do not see a V-shaped recovery for the global economy, and therefore semiconductor demand is expected to be weak in 2020. According to the Semiconductor Industry Association, global semiconductor sales have fallen since November 2019 to $34.5bn in February 2020. This was a decrease of 2.4% m/m from January, consistent with our views in previous reports; sales on a year-on-year basis were 5% higher. The first indication of the impact of COVID-19 on demand was the 7.5% decline in China’s semiconductor demand. Japan did offset this decline slightly by a 6.9% m/m increase. This data has not captured the virus spreading across to the western world, and we expect sales to decline significantly in March and April, especially in the Americas and Europe where sales growth was negative and marginally positive respectively - we expect global sales to be negative. However, investors would do well to remember this data is historical but recent earnings results from Intel suggest Q2 won’t be much better.
Global Semiconductor Sales
Semiconductor sales are expected to worsen before they start to improve.

Chinese customs data shows that imports of unwrought tin & alloys surged higher in the first three months of 2020 to 2,840 tonnes. Sceptics will highlight seasonal loading before Chinese New Year, but this figure is the highest since 2013. The 15-year average of tin imports is 1,319 tonnes, and we expect figures to moderate slightly due to a lack of labour at ports, unloading issues, as well as the virus spreading to other parts of Asia, where tin is mined. Exports for tin in the first three months of 2020 were 979 tonnes, bringing disappearance to 1,861 tonnes. Chinese refined imports also surged higher to 1,660 tonnes, the 15-year average was 1,037 tonnes. We expect this to be front loading before supply chain constraints set in as well as smelter production declining due to the lockdown prompting a rise in refined tin. China’s smelters rely on Myanmar for concentrate, and production has been falling in recent years. China’s concentrate imports fell 20% last year and were down 18.41% y/y for the first three months to 38,924 tonnes. We expect supply chains to be battling with disruption, but as smelters start to increase production, imports will fall. Indeed, PT Timah temporarily reduced production by 20-30% from mid-March, prompting a decline of exports in the immediate term. The move was triggered by a reduction in global consumption. AfriTin has also suspended production in Namibia as they complied with lockdown policy. Mining operations are suspended while the lockdown is enforced, and the probability of the lockdown being extended is high.
LME vs SHFE Stocks
Falling SHFE stocks may provide tailwinds to Chinese prices.

Demand is expected to be weak in the long run despite the significant stimulus measures from major economies. As China starts to get back to normal, the rest of the world has closed down, and we expect this to drag on the market. A shortage of concentrate may keep operation rates low, and the lack of refined imports availability due to logistical constraints could prompt exchange inventories to decline. Tin prices have started to improve in the first few days of April as risk appetite is starting to improve. Tin concentrate in Yunnan is lower than other provinces at 114,114,500RBM/t vs 118,000RMB/t. Solder prices also gained ground with LF bar at 134,000/t, and the solder bar (60A) was at 89,000RMB/t. The LME tin spread has tightened significantly despite the weak demand outlook. The spread trades at $75/t backwardation, after trading at $175/t back.
Auto demand is expected to be hit hard by the coronavirus, with January EV sales in China down 21% year-on-year. Global EV sales are expected to fall by 43% in 2020, according to Wood Mackenzie. Lithium-ion battery production is expected to face headwinds as a result of soft sales. If production stays strong, this would increase EV inventories and could prompt a decline in prices in the longer run. Lithium-ion battery production in China was 162.3m units in December 2019; year-on-year growth has been slowing but was 10% y/y in December 2019.
Zinc
Summary
The low TCs and zinc prices will likely cause some mines to close for longer than the lockdown. The surplus looks set to be the largest since 2010 when the balance reached over 1.2m tonnes. Demand has fallen significantly, and we expect this to remain the case in the medium term. Operation rates are expected to rise in the coming months. Galvanizers’ stock days of consumption have increased, but these could fall as smelter output starts to rise. We expect zinc prices to remain on the back foot, selling rallies caused by mine curtailments.
Q1 Review
Losses for zinc were down 16.30% for the first three months of 2020 and, losses from the 2019 high in April, 35.58%. Selling pressure has been pronounced due to the virus recalibrating S&D balance sheets. Indeed, zinc prices were supported below $1,800/t, but momentum is still firmly on the backfoot. Logistical constraints on supply chains due to the lack of workers have complicated the market. Smelter production fell due to the seasonal New Year’s celebrations, but workers were unable to come back to work due to the travel restrictions. Operation rates for zinc concentrate producers have been in decline since December 2019 and stood at 41.7% as of the end of February. According to SMM data, refined zinc producers’ operating rates have declined to 74.5% as of February 2020.
Zinc Calendar Spreads
Spreads remain in contango with fundamentals weak.

LME inventories have increased in Q1, gaining 42.82%, as stocks closed the quarter at 73,125 tonnes. Despite lower operation rates than usual at smelters and potentially a loss of production, consumption remains woeful, and this could give rise to exchange inventories. This was exemplified by the incessant rise of SHFE inventories, gaining 463.7% to 158,139 tonnes as of April 3rd. Spreads remain in contango and have widened moderately into the end of the Q1 to $10.75/t contango, keeping the trend intact after $161/t contango.
Outlook
The supply outlook for zinc was looking positive in 2020 with production set rise, however, due to COVID-19, mine capacity has been suspended. Suspension in Peru due to the countrywide government restrictions includes Pan American Silver Corp. and Volcan. Newmont Corporation and Gold Resource both in Mexico have curtailed operations at their mines and similar to other major mines, organisations are taking this time to conduct maintenance throughout the month of April. We are waiting to hear if these mines will open after April, potentially with reduced staff and at a lower capacity to protect the workforce. This is dependent on government lockdown policies. In addition to these temporary closures, there have been long term closures due to high TCs and coronavirus in Australia and Namibia. Mine supply is expected to decline year-on-year in 2020, the total amount is unclear at this time, and preliminary forecasts suggest a 3% decline in mine capacity this year, which equates to about 400,000 tonnes. Consumption has been weak in recent years, and we expect this weakness to be compounded this year, paving the way for further cuts.
Zinc 3-month Price vs Cash-3-month Spread
Zinc prices have been trending lower since February 2018, and we expect prices to remain under pressure.

TCs are expected to fall sharply; imported zinc concentrate has fallen from average $250/t as of April 1st to $160/t as of April 30th, and we expect TCs to remain weak in the coming months. Domestic concentrate TCs have also fallen, albeit not in the same magnitude, to average RMB5, 200/t as of April 30th, down $550/t from last month. NBS data shows that Chinese mine output for January and February was 295,000 tonnes, almost half the combined production of November & December of 560,000 tonnes. The seasonal aspect must be considered, however, output in China in the first two months of 2019 was 400,000 tonnes. The demise of TCs is explained by the reduction of mine output and the strong smelter production. Smelters produced 1.49m tonnes of zinc in the first three months of the year, up 11% in the same period last year. We expect smelter production to be high in the near term, but the fall in TCs will impact profitability, and with exchange prices low, free zinc will not add much to the bottom line. Soft mine production will cap the concentrate surplus. The Ministry of Industry & Information Technology raised the requirements on energy conversation, environment protection, resource utilisation and safe production. This is likely to increase costs in order to adhere to the new regulations. Total zinc recovery needs to be above >95%, and the sulphur capture rate needs to be >99.5%. Indeed, the water recycling rate must be above 95% as well.
LME Stocks vs SHFE vs Lianyingang Inventory
Zinc concentrate stocks have trended higher in recent years in keeping with mine supply.
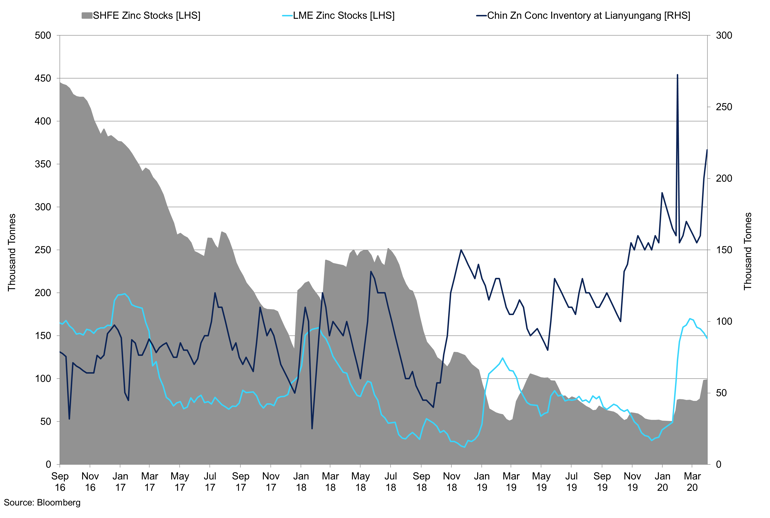
Zinc inventories have been rising so far in 2020, with LME inventories rising from 49,775 tonnes in January to 97,300 tonnes as of April 16th. COMEX inventories have been falling but remain low at 202 tonnes, SHFE inventories surged higher in February to 160,011 tonnes but have since started to fall to 153,318 tonnes. Social inventories continued to increase in recent months to 262,450 tonnes. Zinc concentrate inventories at Lianyungang port held around 160,000 tonnes recently. According to SMM, Chinese zinc concentrate production started to recover in March, but it is still a long way of December 2019. China is the largest producer, and consumer of zinc and their ore’s output would be able to satisfy 71% of its consumption at smelters according to SMM, as of 2019. Indeed, China accounts for 61% of global zinc ingot demand, with 46% of global production.
Zinc operating rates have unsurprisingly declined. Medium-sized concentrate producers operating rates fell to 8.3% in February, while small producers were 19.2%. Large scale producers were least effected and ran at 45.6%, but operation rates were expected to increase once again in March. Galvanising accounts for approximately 50% of zinc demand and operating rates for February were 23.3%; however, this is expected to recover in March to 66.9%. Galvanisers’ stock days of consumption have increased to 14 days, and we expect these to start to level off as operating rates start to improve. Zinc diecast alloy operating rates were 11.34% in February, but the survey suspects operating rates for March.
Zinc Operation Rates
Galvanising rates have started to improve, but diecasting rates are still subdued.

Global consumption is reliant on the auto and electronics industries. The supply disruption in China created issues for South Korea and Japan as manufacturers had to suspend production. Auto sales have been woeful so far in 2020 due to the virus, while there are some signs of m/m improvement in China we expect the industry to be on the back foot for a while. European zinc demand is driven by the auto industry with 70 plants across the region, which is heavily reliant on imports and we expect inventory to rise as production is halted. Europe represents about 17% of global zinc demand, with the U.S. at 12%, according to the American Iron and Steel Institute. Shipments of the galvanised sheet were 2.5% lower y/y in 2019 at 14.2m tonnes, imports also fell 18.9% to 2.27m tonnes. The large rise in unemployment will exert downward pressure on car sales in the long run due to lack of earnings and around 50% of U.S. households having no emergency funds with 60% saying they couldn’t tap into rainy day funds and could not cover three months of expenses with savings, according to a survey by the Fed. This suggests over 10m of the recently unemployed people will not have enough money for everyday living, let alone cars.
Iron Ore & Steel
Summary
Consistent with our previous report, lack of seaborne iron ore supported prices in Q1. Chinese crude steel output was 1.2% y/y for Q1, which equated to 234.5m tonnes. However, implied demand fell to 69m tonnes for February. President Bolsonaro’s refusal to accept the severity of the coronavirus could trigger Brazil’s exports and production of iron ore to decline, helping to support prices in the near term. We could see inventories continue to fall if Brazil’s exports start to fall. If Brazil’s exports and output remain steady, we anticipate prices to fall in Q2. Conversely, a reduction of output would keep prices supported, especially higher quality fines.
Q1 Review
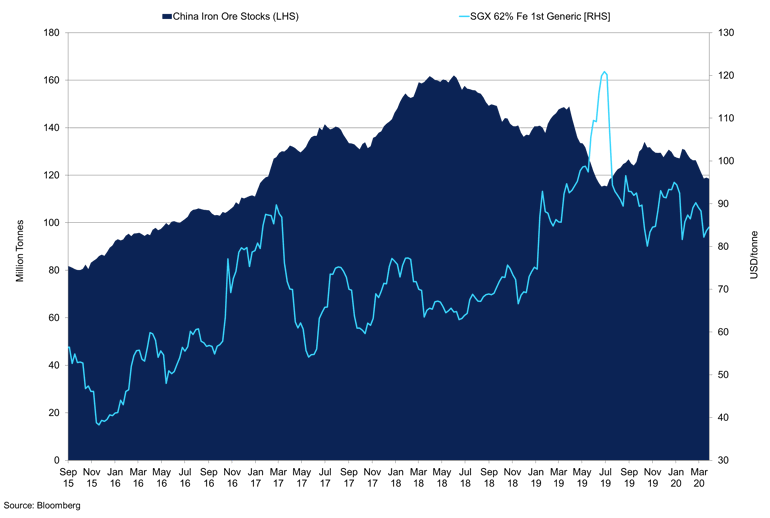
Iron ore prices fell 7.6% in Q1, and were well supported at $75/t but struggled at $90/t. Losses were relatively small compared to base metals, this is due to a fall in seaborne iron ore which prompted a decline in total Chinese iron ore inventory to 109.65m tonnes. So far this year stocks are down 6.58%. Inventories have continued to decline in April to 107.57m tonnes. We expect stocks to continue to decline as we see delays at ports around the world due to lack of labour. As countries increase stimulus, this could prompt positive sentiment in the iron ore and steel markets and accentuate the lack of seaborne iron ore for China. The U.S. is expected to bring another round of stimulus into the economy which could support infrastructure, but the high debt levels in Europe and high debt to GDP in China means that China is unlikely to embark on stimulus packages of old.
Steelhome China Iron Ore Port Stocks vs SGX 62% Fe 1st Generic
Lack of seaborne iron ore caused inventories to fall, supporting prices.
SHFE steel rebar prices have fallen 12.4% YTD, and HRC is down 15.2% as of April 9th, the lack of demand from construction is expected to weigh on prices in the near term. However, if stimulus packages do target infrastructure investment, this could support steel prices, but finished steel inventories remain high, and this could cap gains in the near term.
Outlook
The Chinese economy has buckled in in Q1; industrial production declined 13.5% y/y in the first two months of the year. March’s manufacturing PMI in China rebounded to 52, from 35.7 in February. We expect this figure to figure to fluctuate and are unlikely to improve much more, it is worth remembering these readings are sequential, and March’s figure is reflective on the improvement m/m and not on previous levels. The Ministry of Finance approved 1.29trn yuan of special bonds, RMB1trn have already been issued. The government may target infrastructure as a way to support the economy, however, debt to GDP percentage is already high, and this may limit their spending power. Accordingly, infrastructure investment fell 30.1% y/y throughout the same period. Indeed, this could present some downside to iron ore and steel demand forecasts if this continues. Fixed asset investment in China fell 24.5% Y/Y in the first two months of the year; CAPEX is expected to be weak as firms hold cash.
Chinese Finished Steel Inventories
Finished steel inventories have surged higher due to supply chain failures and weak demand.

We saw some maintenance at steel mills in March and April, which caused output to fall 7% m/m. Profits have been thin while demand was weak, prompting the maintenance work. According to an SMM survey, 35 steelmakers plan to produce 9.03m tonnes of HRC and plates in April, down 0.2% m/m. Accordingly, less than one 1% will be exported in April, a similar figure to March. Steelmakers are expected to favour the production of HRC over CR to maintain profitability. HRC production could increase by nearly 500,000 tonnes as weak demand for CR products narrowed the CR-HRC premium. In the week ending April 10th, Chinese social warehouse of HRC declined by 3.6% to 5.26m tonnes. Social inventories fell 3.3% to 3.88m tonnes; steel mills also saw some destocking with stocks falling 4.3% to 1.38m tonnes. Tangshan China BOF steel utilisation rates are recovering back to 77%, the steel PMI was 56.9 for March 2020 with the transportation sector and construction showing strength. There is some optimism surrounding improved demand conditions due to economic stimulus and the Chinese economy getting back to normal. This may trigger further declines in inventories as the physical market improves, however, we expect price gains to be comparatively muted as HRC warehouse stocks are 76% higher y/y. Production cuts and maintenance are unlikely to offset the total demand loss we saw.
Steel rebar social warehouse stocks have also been declining in recent weeks to 12.03m tonnes, suggesting that the construction sector is starting to recover. Rebar inventories at steelmakers stood at 5.39m tonnes as of the April 9th, according to SMM. Overall rebar inventories are 17.42m as of April 9th a decline of 5% w/w, but inventories are 81.9% y/y. Rebar production has started to improve according to Mysteel Global who suggest output has increased for the 8th week in a row, up to April 8th to 3.3m tonnes. Data for January and February were very weak, with property investment down 16.3%. Floor space for new starts and completions were down 45% and 23% respectively. We would need to see land sales start to improve in the coming months to suggest a recovery in the construction sector. Finances for developers are likely to remain weak in the near term due to weak balance sheets from over the virus. However, the government has previously had tight policies on financing in the property sector, but we expect these to soften in the near term to support the industry.
China Top 5 Imports
Imports surged higher in January, frontloading?

From a supply perspective, we have seen some iron ore capacity suspended. Vale has been in the spotlight after the Brumadinho disaster, and they have reduced output in their Malaysian mine at Teluk Rubiah Port terminal. Production was suspended for 24-31st of March, impacting 500,000 tonnes of sales, according to SMM. In South Africa, all mines in the country were suspended, last year 42m tonnes were exported to China. This accounted for about 64% of S.Africa’s iron ore exports last year, bringing total mining production too about 64m tonnes. We do not expect mining to be stalled for the rest of the year, but the virus is expected to have a greater impact in supplying countries where some portion of civilians live in very close quarters, and medical facilities are worse than advanced economies. This applies to Brazil, where Vale is taking steps to mitigate the risk to its miners. They are installing thermal cameras to identify workers with symptoms. They have also ordered large numbers of testing and PPE equipment from China. We do expect mining capacity to be hit by the virus incapacity.
Australian 62% Fe CFR N.China vs Brazilian 65% Fe CFR N.China
Demand for higher quality fines has caused the spread to widen once again.

Iron ore spreads have started to widen once again due to demand for higher quality fines. The spread for imported 66% and 62% fines are $16.4/t; indeed the spread for 58% vs 66% fines is -$28.7/t, which has widened from -$9.4/t in September 2019. This is the case for domestic fines; the 58% to 65% Fe fines CFR Qingdao spread is -$29.8/t as of April 30th 2020. The FOT Qingdao spread between 58%-65% Fe fines is -$31.8/t as if April 30th. Lump prices and pellet prices have strengthened considerably in recent months, prices of 65% imported pellet is $135.2/t with an imported 62% lump at $106.1/t.
Gold
Summary
The spread of COVID-19 affected global markets significantly, and investors urged to gold for the search of a safe-haven. An array of interest rate cuts and injection of trillions of dollars' worth of rescue packages have eased some pressures off gold buying. However, uncertainty about the global outlook will likely continue to support gold prices in 2020. On the other hand, mine and refinery closures will make it harder to access physical gold, that was already running low in Q1. We expect overall gold demand to remain strong, mainly prompted by elevated investor demand.
Q1 Review
The first two months of the quarter saw gold prices outperform equities and other precious metals. However, as the virus spread continued to take a toll on Europe and the US, we saw prices retracting by 12% in March. The need to raise cash prompted massive liquidations across precious metals, despite the virus-driven slowdown and a drop in crude urging investors towards a safe-haven. Indeed, the net length in COMEX futures declined from this year's peak of 284,972 contracts on February 25 to 178,056 on March 31 as some investors have been forced to sell to meet margin calls.
As of Q1 2020, gold is up by 3.96% YTD. More than 30 central banks have cut rates and introduced additional bond-buying measures. Governments around the globe are pouring trillions of dollars into emergency packages to support their nations. However, growing budget deficits, low and negative interest rates and massive currency depreciation combined bring forward a higher risk for investors to bear. Therefore, gold's subsequent recovery in March is a testament to its overall strength as a safe-haven in this turbulent market. In March, gold ETFs saw the biggest net inflow since September 2019, edging closer to 90.53Moz, from an average of 82.32Moz a quarter ago. According to WPIC, global funds across regions have seen $3.6bn of net inflows in March.
Gold Spot vs All Known ETF Holdings
We saw spot gold move in tandem with global ETF holdings in Q1 2020.

In 2019, global gold reserves grew by 650.3t, the second-highest annual total in 50 years. Most of the new gains came from emerging markets, each increasing their reserves by more than one tonne in 2019, highlighting their search for stability. In the first two months of 2020, we saw a reversal in this trend, as banks mostly stopped shopping for gold. In February, a net 36 tonnes have been added to CB reserves, 30% higher m/m, but 52% lower y/y, as countries such as Turkey, Russia, and the UAE continued to purchase gold to expand their foreign reserves.
Central Banks Gold Reserves
Russia and Turkey continue to purchase gold, however, at a slower rate than in 2019.

China, which accounts for over 30% of global jewellery demand, experienced a 51.1%y/y contraction in gold, to 92.04t, in the January to March period. Bar and coin consumption fell by 47% y/y in the same time period. Higher gold price volatility, combined with expectations of weaker economic growth, have resulted in softer consumer demand for gold in 2019, and subsequently in Q1 2020.
Outlook
Risk-on appetite has started to re-emerge in financial markets as investors believe the COVID-19 curve is flattening as cases start to decline. We anticipate inflows of liquidity, boosting stock prices. The overall outlook remains gloomy as uncertainties about the virus and global demand prevail; this is expected to impact corporate earnings significantly. Uncertainty surrounding the global economy, oil markets, COVID-19 and tensions in the Middle East is a boon for haven demand, and we expect any dips due to positive economic news/results to be well bid. However, in our opinion, the outlook for gold is strong, and we expect prices to remain on the upside. Some headwinds prevail, as a stronger dollar and low inflation could hold gold back.
Gold Spot vs US Economic Policy Uncertainty Index
The gold spot has picked up since selloff in March on the back of an uncertain global environment.

In the longer-term, given the Fed's liquidity injection to households as part of the rescue package, inflationary risks might intensify, driven by increased consumer spending. However, according to a Fed survey in 2019, 60% of US citizens do not have enough funds or savings to cover 3-months of expenses; this in conjunction with jobless claims rising to 23 million will provide headwinds to the economy. Inflationary pressures could also come from the global supply-chain disruptions, helping support gold prices. We expect another round of stimulus measures this year, with the main focus on the Fed, which could drive investors into bullion. Known ETF holdings have been rising in 2020 by 14.72% to 95m ounces. We expect this trend to continue, especially as US-Iran tensions escalate once more in April, gold enters the stage as a geopolitical safe-haven. Any retaliation, and how it plays out, could be the catalyst for movement in the gold market.
While gold usually gains from the risk-off environment, we have seen the precious metal move in tandem with equities and bonds, with sharp sell-offs seen in March prompted by investors liquidating long positions to free up cash in order to pay margin calls. Gold's last sharp selloff took place during the Great Financial Crisis (GFC) when investors were in need to cover their margin calls. After the GFC, gold was one of the best-performing assets from 2009 to 2011, where the economic recovery was gradual: wages did not rise, and inflation remained low.
Gold Spot vs US 10Y Yield vs MSCI World
At a time of subdued global economic activity, gold remains the prevalent safe-haven asset in 2020.

Globally, demand for physical gold surged as investors seek physical gold to protect themselves against heightened risks; however, with refineries temporary closed and commercial transportation halted indefinitely, access to the precious metal seems more challenging. All these factors combined have led to a massive squeeze in gold futures in New York by the end of March. We anticipate the spread to narrow once logistics and mine operations re-stabilise.
Going forward, major markets in Asia will likely continue to support gold prices, with most of the new buying coming from China. While we see a faster recovery in industrial demand, consumer purchases of jewellery might take longer than expected, consumers in China remain uncertain about spending. In the first two months of 2020, Chinese gold imports fell 50% y/y, with national retail sales of gold, silver and jewellery down 41.1% y/y in the same period. We do not expect a significant rebound in gold jewellery demand as prices remain high against local currencies, and consumer spending is subdued.
In India, gold imports fell by 73% m/m in March, as the local currency depreciated by 4% against the dollar in the same month. As a result, gold prices in India have moved to new highs in April, breaching INR47,000/10gr for the first time. Nationally, the government has announced the timeline for issuance of sovereign gold bonds, the price of which will depend on the price of the underlying commodity. Nevertheless, according to the Indian Chamber of Commerce, gold demand will drop 30% y/y in 2020. This would make it the smallest annual purchase since 1995.
From the supply side, lower oil prices should have helped gold miners to cut costs, as around 50% of their production costs are closely related to energy prices. In combination with elevated gold prices, this should translate into improved operational margins for miners. In the quarter coming ahead, we see investment demand dictating gold prices, especially as physical supply remains dormant.
Silver
Summary
Exacerbating negative economic outlook, driven by the spread of COVID-19 taking its toll of global manufacturing and overall demand, silver prices edged closer to $12/oz, losing 21% during the quarter. Along with other precious metals, we saw some substantial price losses in March on the back of investors liquidating their positions to finance margin calls. Overall, silver is holding onto its safe-haven properties. Once we enter the post-pandemic stage, we should be able to see some substantial recovery in investment demand. Jewellery sales will likely remain subdued as consumers remain uncertain about spending.
Q1 Review
Silver, given its low price in comparison to other precious metals, suffered the biggest relative losses in Q1 2020. Silver fell 21.8% while reaching a decade-low of $11.64/oz on March 18. Since then, prices saw a surge in momentum, rallying 17% up to $14/oz on March 31. Silver traded higher amid the US government reporting a record-high increase in jobless claims, with up to 6.6m filing in one week alone. We believe that the demand for bar and coin in Q1 had rebounded on the back of a buying spree across all major markets when the silver prices plunged. Indeed, the US Mint sold 5.5Moz of silver coins in March. Silver ETF holdings have also improved in Q1, picking up to 64.88Moz by the end of the quarter.
Silver ETF vs Spot Price
In April, spot silver fell to a decade-low, while ETF holdings remain elevated.

In 2019, total physical demand for silver dropped 2% y/y to 1.035bn ounces. This could be attributed to weak industrial demand and poor global jewellery sales. Industrial fabrication fell 4% to 555Moz, dragged down by the global economic slowdown and the Sino-US trade conflict. The largest decline in volume was recorded in the electronics sector, where demand for silver fell by 8.6Moz. Demand from the photovoltaic (PV) sector fell by 3% y/y to 74.2Moz, as its use in the modules declined even despite a rise in global PV installations. From the supply side, mine production declined marginally by 1% to 850Moz, with higher output coming from North America and Europe.
While gold has not been immune from a general market selloff, the ratio between the two metals widened to a record high of 124 on March 20 as the spread of the virus hammered metals with industrial applications. Since then, we have seen marginal recovery based on silver offsetting some of its losses.
Outlook
The outlook for silver remains positive in Q2 2020, attributed in part to positive spill-overs from gains in gold, as they both continue to benefit from macroeconomic and geopolitical uncertainties. As with its sister metal, which rallied partly attributed to supply gap, silver could also be supported by a drop in production. Increased investment demand for silver could push prices above $17/oz in 2020. From the speculative side, there is still more room for higher interest to come through, especially as it is seen as an alternative to the gold that could be short on supply in 2020. Additionally, in comparison to gold, silver volatility remains higher. Because of this, silver could be more of an attractive investment, especially as we see gold-to-silver ratio trading at record highs. Silver is also not as liquid as gold which means each rush of new buying has an outsized effect on prices.
Gold-to-Silver Ratio
The ratio rallied to record highs, as gold prevailed and silver saw massive selloffs in March.

With world interest rates at a record low, the opportunity cost of holding physical silver is lower relative to other yielding instruments. However, dormant inflation in the US and the elevated dollar could cap the returns on the precious metal. In a longer-term, we believe that the inflationary pressures caused by trillions of dollars being injected into the US economy have not been priced in by gold or silver. Moreover, with the recent emergency Fed rate cuts, the huge interest rate differential favouring the dollar has been mostly eliminated, giving rise to a lower dollar in Q2.
After the peak of the COVID-19 cases, countries around the world will begin their efforts to restart economies, and silver should benefit from a spike of recovering industrial demand. While we saw gold as the star of Q1 2020, in our opinion, silver will have its chance to catch up in 2020. As governments seek to bolster economic recovery, infrastructure will be an important investment directive, and such areas as solar panels and 5G technology could spur on demand for the precious metal further in 2021.
In the short-term, however, the precious metal does face some headwinds. The global economy has come to a halt, and many governments implemented 'stay-at-home' instructions urging people to abstain to social interactions. Once we see some easing in the developed economies, industrial demand could begin to shine. And while silver has some safe-haven properties, it lacks diversification flows as gold does. Therefore, while a global slowdown will weigh on silver industrial demand in, investment demand will drive prices higher in Q2 2020.
In a similar vein to gold, the panic over the virus spread has led investors to physical silver buying. This, however, presents some challenges for mints as refineries across the world remain temporarily closed. In March, physical silver demand saw a massive resurgence on lower prices. Many mint shops and precious metal stores across Asia and North America have reported running low on inventory, as coin and bar sales have been picking up very strongly. There has been a big rebound of silver in India, the largest consumer, as demand for silverware and bars surged in February. We believe that this spike of demand will not last given the massive shutdown of stores and refineries across the country.
Similarly to Asian economies, the Perth Mint, Australia's largest bullion manufacturer, reported an increase in silver sales in March as demand for havens surged. The US Mint saw unprecedented demand for its American Eagle silver coins in March, selling 3.1m bullion coins. Sales are up 750% m/m, and demand is up 550% y/y.
China is cautiously trying to get back to business, in a sign of confidence that the virus is under control. However, consumers are still fearful when it comes to spending, as many afraid of losing their jobs or catching the virus. In the first two weeks of March, China's monitor and TV imports dropped 66%, against a 45% drop in total imports. Forecasters expect little to no change in growth in spending on clothing, food and electronics. Measures have been implemented encouraging people to buy, including shopping vouchers. We saw consumer spending shrank 23.7% y/y in March, and we expect the April figures to remain low on a year-to-year basis.
From the supply side, international lockdown measures have halted mining and refinery production for the producers, Mexico and Peru, that are to remain shut at least until the end of April. As of April 1, 32% of silver production is currently being suspended, averaging close to 23.1Moz per month.
Spot Silver vs S&P Volatility index
Record-high equity volatility urged investors urged to sell silver to cover margin calls.

Prevailing global uncertainty in 2020 may exacerbate the significance of system demand, especially in the PVs. According to Woodmac, early-stage utility projects face unprecedented headwinds, as solar deployment in 2020 has been slashed by more than 18%. Slowing construction postponed tenders, and financing remains uncertain. This will also be a drag for 2021, as projects that have been slated will be harder to bring back to the market on time. Some tailwinds prevail, as a temporary truce in the trade war could help Chinese recovery, especially in the solar panel industry.
Palladium
Summary
Palladium prices fell to September lows in March as investors liquidated long positions in precious metals amid risk-off sentiment due to the spread of the virus. Metal prices later found support once again on the back of a supply gap. In Q1, palladium rallied 21% despite lowest on record ETF holdings. For the quarter ahead, while we see some recoveries in the automotive sector in China, other hubs such as Europe and the US will take longer to catch up given their prevailing lockdown conditions. Industrial demand remains dormant, however, is seen picking up later in the year, driving palladium prices. The case for another rebound seems to be more likely in 2020.
Q1 Review
Palladium, one of the best-performing commodities in 2019, tumbled to September 2019 lows as coronavirus fears as well as weaker ZAR and RUB hammered the precious metal performance. Prices had tumbled 48% since the peak in January when the metal reached a record level of $2,880/oz. On March 16, with support from a supply gap, palladium found support at $1,495/oz and recovered most of the losses, resulting in a 21% YTD increase in price.
Most of the selling came from the speculator side, as CFTC net non-commercial position subsided to 5 contracts on March 24 from 11,368 net long at the beginning of the quarter. The ETF for palladium holdings continued their decline, despite seeing some recovery in prices, reaching lows of 425,000 last seen in March 2008. We attribute this contraction in investment demand as a reflection of a slowdown in overall global growth, especially the automotive sector. However, a shutdown of mining facilities in South Africa should further add to the metal deficit in Q1 2020.
Indeed, China, the biggest palladium consumer, posted a historic economic slump, with industrial production declining 1.1% y/y in March, a rebound from 13.5% decline in the January-February period. Even as factories begin to restart operations in China, suspended manufacturing in Europe will slow the recovery in palladium demand, especially in H1.
Outlook
As we look forward, dormant car sales globally will continue to be a drag on palladium demand. We did, however, see some price recoveries in Q1 on the back of industrial consumers taking advantage of discounted metal to stockpile. Auto dealerships have been closed in Western economies, and stimulus suggestions, including looser car-purchase limits for Chinese consumers, have been implemented to revive growth in the auto sector. According to KPMG research, 80% of surveyed automotive companies reported being directly impacted by the coronavirus, and 78% lack staff to run full production lines.
German Petrol and Diesel Car Sales
Both diesel and petrol vehicle sales declined in March as automakers and dealerships were forced to shutdown amid global pandemic.
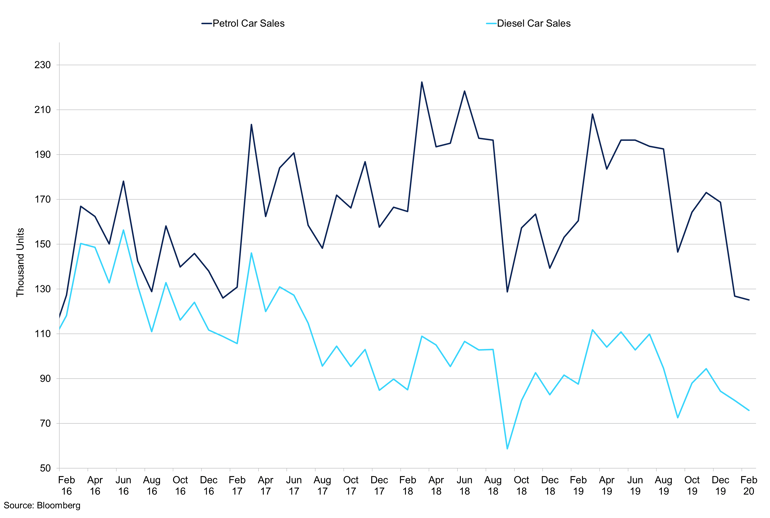
However, more than 80% of the world’s auto supply chains lead to China, where 100 automotive suppliers operate in Hubei alone. According to CPCA, national vehicle retail sales in April are estimated at 1.39m units, down 8% y/y, amid the confidence generated by the stimulus packages and successful containment moves. Production rates, however, remain low given low demand nationally and overseas. As a result, exemptions on payments of highway tolls have been introduced until the end of June to keep the demand elevated. Overall, Moody’s forecast a drop in global vehicle sales of 6-8% for 2020, with a knock-on effect into 2021.
Russian producer, Nornickel, reduced its 2020 estimate of palladium consumption, down 8%, amid weaker global car sales. Indeed, in the UK, new car registrations fell by 44.4% in March, while sales of petrol cars were down almost 50%, with diesel car sales down by 61% as demand fell. In Europe, petrol new passenger cars constituted 57.3% in Q4 2019, marginally no change y/y. Diesel vehicles, however, subsided from 34.1% to 29.5%, indicating a general trend of compliance with Euro-6 emission regulation. While in 2020, we will see slower demand in both types of vehicles, petrol types that use palladium will be in preference to platinum loadings.
Platinum
Summary
Platinum suffered the biggest losses amongst precious metals, down 45% in March, with prices finding support at $564/oz by the end of the quarter. Ongoing mine closures in producing countries will continue to influence prices, even as the pandemic hammers the auto industry. Industrial demand is likely to remain subdued throughout 2020, as the impact of the virus adds pressures on manufacturers and automakers. From the investment side, we expect platinum to hold on to its safe-haven properties, as an uncertain global environment persists.
Q1 Review
Platinum, along with other precious metals, has struggled in Q1 2020, as the outbreak of the coronavirus took a toll on global supply chains and investor confidence. While gold has managed to hold on to some of its gains in the face of the pandemic, the platinum-group metals have been less successful in retaining value. Platinum, which first reached its high of $1,022/oz in January, lost as much as 45% YTD on March 16, reaching lows last seen 17 years ago. On March 19, the white metal managed to find support at $564/oz on the back of the largest on record US economic stimulus and is now seen fluctuating around $770/oz level. Concurrently, all known ETF platinum holdings subsided from record highs of 3.468m to 3.087m on April 17.
According to the World Platinum Investment Council (WPIC), the platinum surplus came down to 65koz in 2019, from 790koz in 2018, with total supply and demand increasing 1% and 11% y/y respectively. Significant increases in the metal’s value urged higher levels of catalyst recycling. From the supply-side, South African mine closures in 2019 and the first quarter of 2020 provided some level of support for platinum group metals. According to government representatives, the 21-day closure for the mining sector should ease the spread of the virus, yet lead to lower production figures for Q1 2020.
Outlook
WPIC forecast a 2020 market surplus of 119koz, with the total supply of 8,117koz and demand of 7,998koz. Supply will benefit from ongoing refining of existing inventory. However, price headwinds prevail, such as power disruptions as well as some temporary mine closures until the virus spread eases. Recycling material is expected to rise this year, stimulated in part by high PGM prices.
Demand in 2020 is likely to remain subdued, at least for H1 2020, as the impact of coronavirus will continue to add pressures on manufacturers and automakers. While we still see China and Europe benefitting from palladium catalyst loading in the long-term, in our opinion, car manufacturers could substitute some of the palladium for platinum given palladium production remains subdued.
Platinum ETF Holdings vs Net Position
We see ETF holdings subsiding closer to 3Moz after reaching record highs in February.

From the investor side, we expect platinum to hold on to its safe-haven properties, as an uncertain global environment will continue to support the metal, at least in the first half of the second quarter. Once the developed economies enter the post-pandemic phase, we believe that it might take a while for industrial demand to normalise to last year’s levels.
Vehicle markets such as Europe and China have seen a drop in sales, down 52% y/y and 43% y/y in March respectively. Preliminary figures show that new car sales in Italy declined by 98% y/y in the first 24 days of April. Amongst top six countries in terms of the number of car manufacturing, sales declined by 30% y/y in Q1, and a greater drop is anticipated for April figures, as the US and Europe have halted production. This, however, is supposed to be offset as PGM content per vehicle continues to increase, according to Nornickel.

