


Executive Summary
- Sentiment has improved in recent months, with some economists claiming that US and EU might be able to avoid contraction this year, but we believe markets are calling victory on a recession too early.
- While the balance sheet's savings are below the long-term average, American consumers continue to finance their spending through credit levels.
- This year's price decline is unlikely to be smooth, and the markets are beginning to price that in.
- Continued uncertainty about Chinese consumer behaviour will create a volatile exit for the economy, which has spent more than three years under tough restrictions.
- Food inflation has been a hot topic of discussion, and while the wholesale prices for many goods have peaked, retail prices that consumers see in stores show no signs of abating.
- Consumers are seen downgrading to cheaper private brands of goods. With that in mind, we expect sales for branded pods for coffee machines to fall in favour of compatible retail pods.
- With the younger generation being the biggest driver of coffee consumption growth over the long term, we expect to see diminishing coffee content in favour of more milk-based sweeter drinks.
- Chinese demand is set to benefit from the reopening of lockdown restrictions, especially the 1st tier consumers, and with summer sales usually strong given the purchases of cold brew drinks, this could really drive the sales.
- We published our last report in October 2022, when the market was above 200cts/lb, spreads were steady and certified stocks touched the lows of 383,000 bags.
- The past couple of years brought drought, frost, historically high rains, and hailstorms, making it difficult to apply fertiliser to the soil, which is also very costly in this economic environment.
- Taking the average Brazilian exports over the past three years at 41.57m bags and internal consumption at 21m bags, we need 62.57m bags in total.
- The price rally stimulated appetite from exporters, as they benefitted from solid differentials.
- Still, the current supply and its availability are not as ample as was thought to be the case at the end of last year.
- The spreads at a premium highlight the tightness in the market, but we expect this to continue into May and June
- As long as Colombia imports 1.7m bags of Brazils a year, that would confirm that the supply is not there, reaffirming market tightness from the region.
- The scale and pace of the recent increase in Robusta prices are creating risks for a correction in the near term.
- In our opinion, Vietnam crop at this stage is 70% sold, and the market will have to wait until October for the new crop.
- A start of a drawdown could bring back the narrative of market tightness into the market, helping draw down on the certified, helping to support contract prices.
- We expect managed money position to improve as market tightness is felt by the market, supporting price momentum on the upside.
- The increase in positioning for Robusta in recent weeks was accompanied by prices rallying above $2,100/mt and we expect prices to remain elevated in the near term before gaining momentum.
Our View

We published our last report in October 2022, when the market was above 200cts/lb, spreads were steady and certified stocks touched the lows of 383,000 bags. Funds held a net long position of 23,874 contracts. The next three months saw a change of view, as the focus became more pessimistic, and the overall attention shifted towards recession and souring economic prospects. Global markets sold off, and coffee was no exception, marking a low at 143cts/lb, losing 65cts/lb, or 45%, from the 208cts/lb price seen in early October. We feel there were two stories behind the move. Certified pending gradings had built to 872,000 bags; however, we believe the main driver behind this was building estimates for a higher crop number, some reaching as high as 72m for 23/24 Brazil crop. In our October report, we warned of being too optimistic for a large 23/24 crop, with the weather being our major concern. Indeed, the past couple of years brought drought, frost, historically high rains, and hailstorms, making it difficult to apply fertiliser to the soil, which is also very costly in this economic environment. With these factors in mind, a 65m bags Brazil crop is a possible starting point, with a 43m and 22m Arabica and Robusta split, respectively.
Taking the average Brazilian exports over the past three years at 41.57m bags and internal consumption at 21m bags, we need 62.57m bags in total. This marks 36.9% of our global demand figure of 169.50m bags. Internal prices have remained firm, and farmers have remained resilient by selling on rallies, as has been observed in the most recent move to 194cts/lb. Our view is that the 22/23 crop is committed, and April to June, the final quarter prices in Brazil, could reach the BRL1,300-1,400/bag levels. In 2014 we observed a similar situation, where a tight Brazilian market propelled the KC future contract to 219cts/lb, something to keep an eye on.
Trading Strategy
- If the market runs into spec liquidation, and it approaches the 50% retracement level 168-170cts/lb, we advise to look over a June 190 or 200 call.
Macro Overview
Global Outlook
The year started off on the back foot, and the main question driving market sentiment is whether the world's biggest economies will enter a recession. Sentiment has improved in recent months, with some economists claiming that US and EU might be able to avoid contraction this year, given the robust consumer indicators, but we believe markets are calling victory on a recession too early. With the tightening cycle still not over, more pain is to come, and the real impacts of previous hikes are still to filter through. Adding lingering geopolitical risks, Europe's continued exposure to energy risks, and continued uncertainty around China reopening demand, we are likely to see a further divergence in economic performances this year. For the monetary policy's pivot to materialise, more weakness from the consumer and labour market sectors is necessary for the near term.
Developed Economies Yields
We have seen yields rise once again on the back of a hawkish rhetoric from the Fed and the ECB.

US
The US economy, albeit slowing, continues to show signs of resilience in the face of a tighter monetary policy environment: supply chain conditions continue to ease, and input prices are falling amid slower demand. Retail sales, a key indicator of the consumer's propensity to spend, pointed to a sharp jump at 3.0%, underscoring the resilience of an American consumer. While spending on non-essential goods has declined, consumer spending habits remain broadly unchanged. In particular, the service industry outperformed and rebounded from the lows of 44.70 to 46.60 in January as appetite improved. While the balance sheet's savings are below the long-term average, American consumers continue to finance their spending through credit levels. The data shows that US consumer borrowing rose to around $1tr in 2022. Once consumers realise that inflation is here to stay, the impact on retail sales will become more widespread. By then, consumers would have already spent much of their savings. With the Fed's tightening and prospects of economic slowdown, the impact on the real economy will become more prevalent in the latter part of the year.
US Retail Sales vs Personal Savings as a % of Disposable income
Savings began to build higher as consumers worry about the upcoming recessionary environment.

One of the main reasons for improving market sentiment in recent months was the robust consumer and labour sector performance. US job openings remained high at 310,000 in February, after a 510,000 January jump. Another sign of market strength came from the CPI, which continued to ease, to 6.4% y/y in January, but the decline has been marginal, with energy and shelter costs being the largest contributors behind growth. The reading came above market expectations, highlighting the upward price stickiness. Wage increases are not keeping up with prices, at 4.4% y/y, however, we expect higher costs to filter through to trigger further nominal pay increases, further supporting pricing pressures. This year's price decline is unlikely to be smooth, and the markets are beginning to price that in. The implied rates now point to a 100% certainty of two more 25bps hikes in March and May, and 2yr US Treasury yield reached 2007 highs on the back of a bond selloff. The central bank's goal for most of this year would be a tight monetary policy environment while keeping the economy out of a severe recession. Still, continued weakness is inevitable, with real private domestic spending declining, tilting the risks to the downside.
US CPI vs PPI YoY
PPI is declining at a faster rate, while the CPI is seen upwardly sticky.

Europe
By the end of 2022, the European economic forecast was overshadowed by fears of recession and a complete cut-off from Russian oil, putting into question the capacity to endure the cold winter months. In January, the outlook changed; confidence improved across the board. January and February temperatures were mild, natural gas prices fell to 2021 lows, and the euro continued to climb against the dollar. The European Commission is now stating that a recession in 2023 is possible to avoid recession with falling natural gas prices and supportive government policy. Still, we believe that the markets are calling a victory on recession too early, and we are likely to see the bloc's GDP underperform in comparison to the Western counterparts.
EU CPI vs Natural Gas Prices
EU CPI is seen upwardly sticky even with softer natural gas prices.

The most recent CPI figure pointed to a shallower-than-expected decline in inflationary pressures in January, with the level falling back to 8.6%. At the same time, core inflation continues to trace higher, reaching record levels, and is yet to show signs of softening. Core components are catching up with more volatile components and, in line with the US, are set to stay elevated for longer. We do not expect CPI softness to be smooth, especially in Q1 2023. With that in mind, the ECB is set to continue on a path of tightening, and at a faster rate than the US, with forward swaps currently pricing in a 50bps hike at the beginning of next month. However, at the same time, the bloc's slowdown is set to be faster than in the US, especially in the latter half of the year, and we expect the ECB to pivot ahead of the Fed as a result.
China
China's reopening rally seen at the start of the year had faded before it even began. Investors still anticipate higher growth for 2023; however, the optimism is being shifted further into Q2'23 as markets see a lack of demand in the economy despite the removal of lockdown restrictions. Continued uncertainty about consumer behaviour will create a volatile exit for the economy, which has spent more than three years under tough restrictions. This could limit the chances of a quick recovery. The removal of restrictions comes at a time when the economy is weak: consumer and business performance are only just recovering from multi-year lows, and the property market is in a record slump. Overseas appetite for Chinese goods has also plummeted, with exports falling by 9.9% y/y December. We expect prices to respond to a short-term shock once sustainable signs of recovery appear from the demand side, but euphoria will fade eventually, and markets will focus on core economic indicators. Policymakers have pledged considerable support to help the economy recover this year, and fiscal instruments such as budget deficits and special debt are more likely to be used. While the Chinese PBOC stated it does not want to flush the economy with handouts, we expect the policy to be directed at consumers rather than a traditional infrastructure push. Government investment will play a stronger role in leading private investment, boosting consumption, and stabilising foreign trade and investment.
China Manufacturing vs Services PMIs
Both measures rebounded in January following the reopening of lockdown restrictions.

Brazil
The Brazilian economy, in line with more developed countries, sees signs of slowing growth based on softening global demand. Growth for 2023 is set to recede sharply to 0.8%, down from 3.0% in 2022. The one sector that has held up well so far is the consumer segment. Services remain expansionary at 51.0. Despite softening inflation growth, the releases overshoot expectations, and the price decline is slow. We expect inflation to settle at around 5.0% in 2023. The implementation of Lula's fiscal policies is set to prolong the country's inflation but also increase uncertainty in the economic outlook. Lula's government is increasing the size of welfare programmes beyond strict budget limits to address social issues, breaking the fiscal ceiling by BRL145-176bn. Ahead of the re-election, Lula was looking to increase the amount of cheap credit for farmers to spur environmentally friendly practices. This is similar to a programme launched in 2008, called Mais Alimentos. The new government’s transition team is working on a plan to give out more cheap credit and offer lower interest rates to producers that make environmental commitments, as well as a return to the minimum price policy to guarantee healthy wages for producers. Brazil’s subsidies credit to sustainable agriculture has shrunk to BRL2.5bn in 2021, down from BRL4.5bn in 2015, and the pace of recent improvements has been marginal. If implemented, these policies could bring support for coffee producers, especially in the event of low coffee prices, but the impact is likely to be more long-term, beyond 2023. However, this new wave of spending could put Brazil's debt on an even more unsustainable path and stir inflation. With the threat of lingering inflation and abundant fiscal support, the interest rates are likely to remain elevated for longer.
Consumption
Food inflation has been a hot topic of discussion, and while the wholesale prices for many goods have peaked, retail prices that consumers see in stores show no signs of abating. In the US, food price growth seems to have peaked at 0.2% m/m, however, when considering it on a year-on-year basis, gains have exceeded 10%. Within this category, roasted coffee prices in the US have been flat at 0.6%, whereas instant coffee prices continued to decline at -2.2%. Food inflation is poised to grow marginally month-on-month, which will contribute to an elevated y/y figure, adding to pricing pressures on a cumulative basis. We mentioned above that we expect wage growth to begin catching up with inflation in the coming months, and growth in pay and services would mean additional costs for consumers over time. Even with food prices peaking, we do not expect retailers to reduce their prices; this is also relevant for coffee pod consumption in retail stores. We do not expect these increases to be sharp, but each incremental rise will further weigh on consumers. With prices higher for many consumers, we have seen purchases diverge between different. Data suggests that higher-income consumers kept their spending level marginally unchanged, but the price ticket has reduced, given the shift from higher-end retailers to more middle-class. Middle- and lower-end income consumers, however, are seen reducing their shopping bills to fit into a tighter budget. Consumers are also downgrading to cheaper private brands of goods. With that in mind, we expect sales for branded pods for coffee machines to fall in favour of compatible retail pods. Still, the reduction in spending will be most visible in discretionary items such as electronics and less in groceries, only with premium brands feeling the pain.
World Food inflation CPI YoY
European economies are battling with higher food prices, while US remains on the lower range.

Coffee shops continue to do well, and while sale volumes are declining slightly, the increase in ticket prices meant that companies continue to post solid revenues and earnings. Starbucks's global comparable store sales increased by 5.0%, primarily driven by a 7.0% increase in average ticket, with the US being the key market behind revenue increase. Even with revenues at record highs of $8.7bn, the operating margin has reduced from higher wages and other benefits, as well as inflationary pressures. With traditionally higher demand for colder drinks during hotter temperatures, we believe China's recovery could open at a time of peak consumption, adding to coffee demand in the region. Likewise, Nestle's organic growth reached 8.5%, with pricing at 7.5%, reflecting significant cost inflation. Out-of-home sales continued to soften, while retail grew at 8.5% in Q3'22. North American and European performance diverged strongly, with beverage sales at a double-digit rate for the US and a single digit for the EU. Still, recovery in coffee shop sales has not been uniform. In the UK, sales grew by 12% y/y even as cafes and restaurants grappled with inflation and higher energy costs, according to Allegra Group. Consumers did cut down on their spending, but this was not enough to offset the price increases, and overall revenues have improved. The cost of a latte, the most popular coffee drink in the country, increased by 11% to GBP3.25. The only sector that struggles to recover in comparison to others is the city worker, with people still working in a hybrid environment. Indeed, suburban London sales continue to outperform and saw a spike in consumption when others have declined in recent weeks. We expect coffee demand to be mostly maintained this year, even with a possibility of a mild recession. This is especially true for urban consumers with higher incomes and an affinity for coffee as a staple.
Consumers in developed nations generally consume coffee at least once a day. Consumers in those regions are also shown to be especially sensitive to the taste of coffee in terms of factors that influence purchasing behaviour. According to DriveResearch, ¾ of Americans drink coffee every day, and 49% of people drink 3-5 cups of coffee a day. 68% of them make their coffee at home every day (soluble and pods), and 32% purchase coffee from a shop 1-3 days a week. Some coffee drinks clearly are favoured by younger customers. For example, most 18-29-year-olds stated that they love or like iced coffee. Those under 45 are also more likely to love lattes, cappuccinos, frappuccinos, and many other coffee-based beverages that are not simply regular coffee. This highlights the continued trend for more milk-based coffees. With the younger generation being the biggest driver of coffee consumption growth over the long term, we expect to see diminishing coffee content in favour of more milk-based sweeter drinks. January imports into Europe and North America from Brazil stood at 1.480m and 0.569m, down by 17% and 28% y/y down, respectively, according to the Cecafe.
Consumption of Coffee per Capita by Region
1st-tier cities in China see similar level of consumption with developed consumer economies, such as US and South Korea.

Chinese consumers, especially those living in 1st and 2nd tier cities, continue to catch up in their drinking habits to that of the US, and consumers are increasing their coffee consumption, according to Deloitte. As a result, we expect the elasticity of coffee there to decrease, given coffee is becoming more of a staple product. 1st and 2nd tier drinkers consume around 1 cup of coffee a day, and coffee penetration is equal to tea at 67%. However, this is not the case across the entire region and mainland China consumer drinks 9 cups of coffee a year. Therefore, there is quite a divergence between regions, with 1st tier behaving more like a developed market and 2nd tier seeing the sharpest consumption growth as they catch up with 1st tier. As a result, we expect Chinese demand to benefit from the reopening of lockdown restrictions, especially the 1st tier consumers, and with summer sales usually strong given the purchases of cold brew drinks, this could really drive the sales. The world needs a higher supply of both arabica and robusta beans, but demand for Robusta will grow at an incrementally faster pace, given the shift to cheaper blends. We see 169.5m bags for global consumption, which will mark a deficit for this coffee year, and any stocks that were left in origin are going to come out in the next 4-5 months. Off-take in the U.S. remains steady, with import numbers robust and GCA stocks marginally softer. Macroeconomic data shows a resilient consumer, and with job openings still high, this could set the scene for further gains in coffee consumption.
Supply
We published our last report back in October 2022, when the market was still trading above 200cts, and the front-month spread were steady around 8cts premium. KC certified stocks were down at 383,000 bags, 1999 lows, and non-commercial participants were around 23,870 contracts long. Over the next three months, the mood changed, the focus became more pessimistic and key support areas of 154cts/lb were tested, and a low of 143cts/lb was made at the start of January as talk turned towards recession. Non-commercial flipped from 23/24,000 net long to 43,940 net short, the 2019 low. We feel there were two stories behind the move. One was the build-up in ICE certified pending grading, which jumped to 872,000 bags, the series high. Secondly, were the forecasts that the Brazil 23/24 could be above 70m bags. Indeed, the 23/24 crop has seen the largest divergence in market estimates, and investors are not sure what to expect from the next crop. However, inventory remains low, spreads collapsed, and exports are not growing rapidly, suggesting supply might not be so ample. Prices have now recovered to test 190cts/lb on crop figures being downgraded once again. Differentials remained firm, even as the Arabica contract recovered at the start of this year. With differentials holding firm, exporters should benefit from price improvements, but we do not expect exports to increase aggressively. There is some coffee still left in Brazil, but not much, given that most of Brazil's crop is now sold.
Arabica Spreads
Nearby spreads tightened significantly in recent weeks, jumping into a strong premium.

In our previous report, we had cautioned about being too optimistic on production for 23/24 crop. Our major concerns remain intact to this day: weather overall has not been ideal; labour remains in short supply, and wages for pickers are rising. In the past couple of years, we have experienced drought followed by frost, high level of rain and hailstorms. Moreover, the cost and application of fertiliser remain an issue, especially in light of the weather events. In our view, taking the above-mentioned facts into consideration, a 65m bags crop is a possible starting point, with a 43m and 22m Arabica and Robusta split, respectively, which may be on the high side given market estimates. Roasters still have to buy coffee since they bought the futures for price protection but do not have physical. The industry is in good shape, and on this rally to 180cts/lb, they have bought physical nearby coverage. Origin is more active above 180cts/lb, and we believe that as long as origin holds its nerve and only sells rallies, the market can hold. Semi-washed in NY should start to move, and we have seen 10,000 up for pending grading in recent days. We expect April to June to be a tight quarter, and whilst in the short-term, prices might dip back slightly, we could see prices begin to test 200cts/lb over the next six weeks, but this will largely depend on speculator buying.
Brazil
Arabica prices declined in part by market speculation of a record crop from Brazil. But now, this does not seem to be the case, and we expect Brazil to produce 65m bags for harvest from May, given the blossom issues in key areas of Brazil, such as Minas Gerais, the world's biggest Arabica-producing region. Additionally, more fertiliser and other inputs are needed that are not being given. Arabica prices rallied in the first weeks of February, up to 195cts/lb; the buying was done through short covering and was aggressive as we believe specs were too short around 143cts in the past. The price rally stimulated appetite from exporters, as they benefitted from solid differentials. With price above 170/180cts, we saw some coffee come out. Still, the current supply and its availability are not as ample as was thought to be the case at the end of last year. BRL remained unchanged at 5.15, and currency appreciation could benefit exporters as of now, coffee is cheap vs where Brazil is. As of now, exporters seem already covered for their prompt needs and therefore are not active buyers.
Brazil ESALQ vs 2nd month Arabica Prices
Both indicators benefitted from downgraded crop expectations in Brazil.

With the commitment of traders’ reports not being released since January 31st, there is little transparency in the market, however, we expect limited short covering in the immediate term. This has been exemplified by the correction in prices since testing 190cts/lb. At the same time, no one is building spot coffee in the US, and Europe and exports are going straight to consumption, with little old coffee sitting around. With differentials high, certified stocks are once again the cheapest coffee around. The spreads at a premium highlight the tightness in the market, but we expect this to continue into May and June. Pending gradings have declined since November and December last year, highlighting the pipeline of coffee is limited, and with lower exports this confirms to us the market tightness. As of 28th of February, pending grading stand at 54,929 bags.
Brazil Green Coffee vs Roasted coffee Exports
Roasted coffee exports declined in January, falling to February 2021 lows.
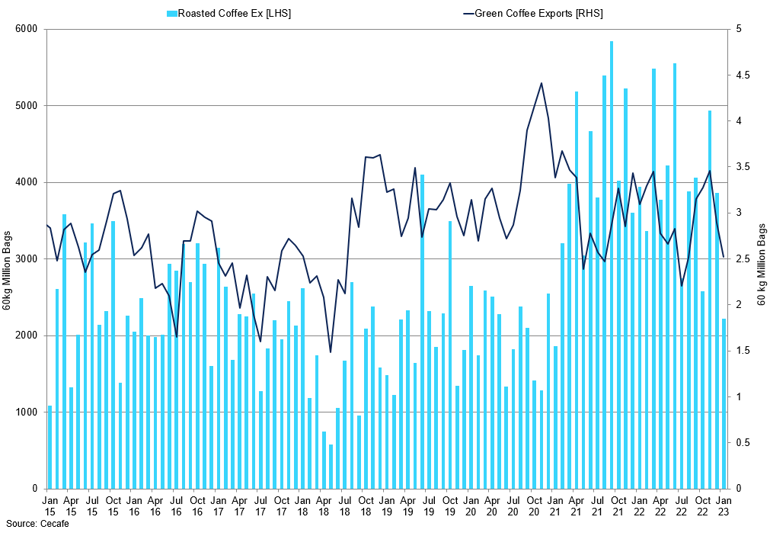
In this current crop year, July 2022 to June 2023, Brazil has shipped 19.35m bags between July 2022 and December 2022; as of March 3rd, February 2023 shipments stood at 2.80m bags, with 1.936m for Arabica and 0.083m Robusta. For this crop year, starting from July 1st, Brazil shipped 22.227m bags, marginally unchanged from 22.858m bags in the same period the year prior, according to Cecafe export figures. Internal prices have remained firm, and farmers have remained resilient by selling on rallies, as has been observed on this most recent move to the 194cts/lb. Brazilians are holding out, getting their prices. Brazil stocks are low, and farmers are holding coffee sell it outright until the end of June, the best price they can get. We will continue to pay attention to export numbers out of Brazil to help gauge the export figures in comparison to the previous crop year. Our view is the current crop 2022/2023 is committed and we expect tightness to accelerate in April-June period, and as a result we expect July contract to test 220cts/lb, the level targeted during 2014 where a tight Brazil market propelled price rallies; spreads should subsequently tighten into a premium. Brazil's conillon production is increasing, but this would not add to Robusta's supply, given it all goes to soluble.
Brazil Arabica vs Conillon Exports
There is less conillon coming out of Brazil in recent months.

Taking the previous 3-year export average from Brazil 2020 to 2022 at 41.57m bags and adding 21m bags for internal consumption, we anticipate 62.575m bags (for export and consumption only) for next year's crop forecast. However, with stocks low in Colombia, Vietnam and Brazil, any supply shock could create strong upside risks. We believe that stocks are at very low levels, and a carryover of 2.5m bags is not large, further underlying market tightness. Our figure lies at a conservative level in comparison to other forecasts, but the crop potential is still capped by lower-than-expected harvest figures. February's weather started with a lot of rain. In the next couple of weeks, additional rains are expected, particularly over the Espírito Santo region, that should see the amount of rainfall increase. South of Minas and São Paulo should get rains as well from the start of March, and more than in Espirito Santo. Overall, a lot of rain fell in Brazil, which could create a risk of disease and fungus, and we must be careful about that.
Colombia
Colombian shipments are still lagging from October 2022 to December 2022 at 2.88m bags exported versus 3.31m bags in 2021. January exports of 835,000 bags were 19% lower y/y, and as a result, we are working with a production number of 12m bags and internal consumption of 2.5m bags. Colombia's diffs have softened slightly to 50-55cts over, but the change is not drastic. Farmers are receiving a good price, with differentials at 50cts over. We do not expect Colombian exports to increase between now and the new crop. As long as Colombia imports 1.7m bags of Brazils a year, that would confirm that the supply is not there, reaffirming market tightness from the region. Reports are that weather has improved, with fewer rains in places that saw heavy precipitation, but at this stage, it is too early to estimate 23/24 production number. For the upcoming months, the coffee flow is set to come down.
Colombian Production vs Exports
Production remains at a historically low level.

Central America
Central American exports from Honduras and Guatemala have been slow, despite a slight improvement in recent months, October to January 22/23, Honduras shipped 1.035m bags and Guatemala 0.413m bags so far. Honduras January shipments equalled 0.506m bags, up by 8.03% y/y, with improvement seen from previously scheduled shipments. Differentials softened a bit to +25 but remained way above tenderable parity, but external demand remains slow, and crops are lower. Markets were expecting a sharper diff contraction, but this did not materialise. Some roasters would still need to buy from April to June, but demand increase should not be sharp. With crops in the region being late and smaller in production, this could further weigh on overall supply.
Vietnam
Robusta 2nd Month vs Dak Lak Price
Both prices rallied sharply so far this year on the back of growing market tightness.
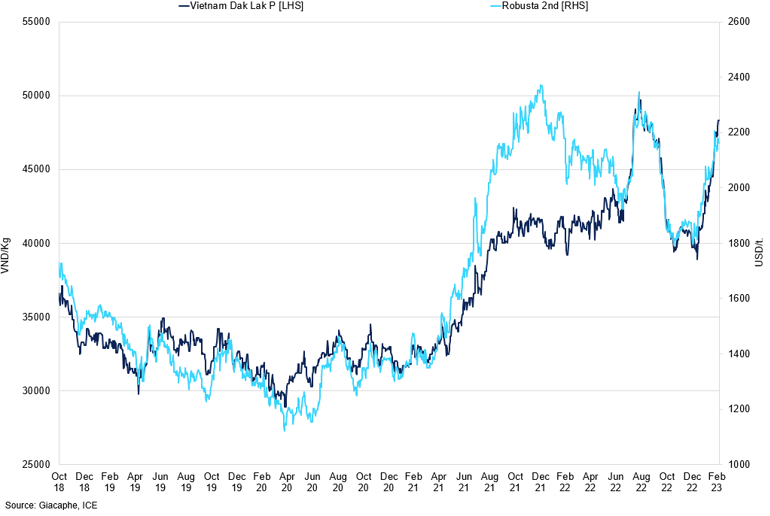
Robusta prices rallied, jumping above $2,100/mt in February, not seen since September 2022. Internal prices are steadily rising from 40,000 dong a kilo to around 50,000 dong, giving producers an opportunity to sell the crop. The price rally was much sharper in comparison to Arabica, given the prevalent shortfall and the shift to cheaper alternatives in recent months. The scale and pace of the recent increase are creating risks for a correction in the near term. Still, the farmer does not want to sell too much coffee. Exports jumped to 3m bags in February, marking the highest level since spring 2018, and 28% growth y/y. Robusta gradings totalled 12,220mt in February; 12,176mt passed. In our opinion, Vietnam crop at this stage is 70% sold, and the market will have to wait until October for the new crop. Still, the market is very tight. We expect tightness to accelerate in H2’23 as global stocks, especially for Robusta, fall. Since our October report, Robusta ICE certified stocks are down 33,710 tonnes to 59,350 tonnes, under 1m bags. We are working with a 29m crop figure for Robusta; with 25m and 2.5m for export and internal consumption, respectively, there is not much carryover. We expect the balance sheet for Robusta to tighten until October, as robusta incorporation in finished products remains at high levels.
Vietnam Exports vs Monthly Dak Lak Prices
We saw higher exports from Vietnam on the back of strong Robusta prices.

Inventories
We have seen stocks rebuild in the latter months of 2022, as supply started to build slightly, and markets readjusted their expectations for a bigger crop figure. Many anticipated a higher level of supply coming in, with some seeing forecast increase up above 70m. Still, stocks are near historical lows, and diffs remain firm. This further highlights the prevailing market tightness, and with most of the crop now sold, we should see further drawdowns from certified stocks in the coming months. Arabica story remains centred around Brazil, and the tightness is driven primarily by slower exports out of the region. A start of a drawdown could bring back the narrative of market tightness into the market, helping draw down on the certified, helping to support contract prices. However, with diffs remaining firm in Brazil, Colombia, and Central America, this would mean fewer bags coming into the exchange.
Inventory by Origin
We saw a slight build-up of stocks in Q4’22, but the levels remain historically low.

Most of the old coffee has been sold, and the flow will be coming from exports, which have been softening month-on-month. February Brazil shipments totalled 2.843m, down 16% y/y, with Arabica at 1.570m. We expect exports to remain in line with current levels into H2’23, but still softer on a year-on-year basis. GCA stocks have peaked in November at 6.390m bags and since then declined slightly back to 6.264m bags; New York stocks hold 1.970m bags, with Houston at 0.825m bags. Certs from Europe have been building up at a faster rate, with Antwerp at 730,546. Robusta stocks stand at 7,013 as of February 28th; stocks have trended higher in recent weeks. Stocks have traded slightly higher, but with the structure still at a premium, we expect certs to be further drawn.
ICE Inventory vs Robusta certs
Both stock levels rebounded slightly from recent lows.

Commitment of Traders'
Breakdown of Trader Participation
Non-commercial appetite is seen building in the last couple of months.

With the commitment of traders’ reports not being released since January 31st, there was little transparency in the market, however, we expect limited short covering in the immediate term. The net length of the managed money for Arabica jumped higher to -16,346 contracts in the week ending February 7th, after testing the low of -43,940. This was accompanied by higher prices, rising to test 182cts/lb. With prices testing the highs of 194cts/lb in late-February, we expect higher momentum from the speculative side. The number of long traders, however, decreased, falling to 99, as shorts fell to 91. Spreading positions have also grown to 108,386 contracts, November highs, after grading has increased slightly; we expect the structure to remain at a premium. We expect managed money position to improve as market tightness is felt by the market, supporting price momentum on the upside. Lower export levels and firm differentials are further supporting this argument.
Commercial positions have significantly increased their gross short, which now stands at 119,946 contracts as of February 7th. The net has decreased to -35,872 as a result, and the flat price fell slightly that week. With firm diffs, there has been some selling, although we believe that roaster cover is mostly done. If the crop comes in lower than expected, this will present significant difficulty for producers who may have sold their coffee on the futures. Local prices are still elevated, with the ESAQL Brazil Arabica indicator at R$1,179/bag. The commercial long has improved marginally to 84,074 contracts as of February 7th. This implies lower cover from roasters.
Arabica Managed Money Positioning
The net length rebounded slightly in February, given the reduction of positions from both long and short.

For Robusta, managed money saw a significant increase in the net length in recent weeks reaching 19,718 contracts as of February 28th. The funds have seen the rally in Robusta and increased exposure; the number of long traders increased to 40. The increase in Robusta blends is likely and would tighten the Robusta balance sheet, and with most of the crop now sold, this should further highlight market tightness. The producer net position shows a short of 21,824 as of February 14th, and, with prices elevated at $2,153/mt, this brought the net length to -24,398 for February 28th, October lows. We expect farmers and producers sold into the rally. The increase in positioning for Robusta in recent weeks was accompanied by prices rallying above $2,100/mt and we expect prices to remain elevated in the near term before gaining momentum.
Robusta Managed Money Positioning
Non-commercial net length continues to grow given the recent price improvement.
