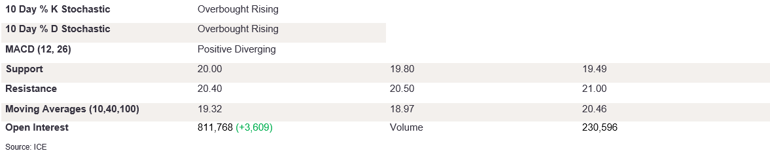
NY 2nd Month Sugar Futures

NY sugar futures edged higher on Friday as intraday trading saw prices supported above 20.00. The market closed at 20.30. The %K/%D is positive and diverging, strengthening into the overbought territory. The MACD diff is positive and diverging, suggesting growing buying pressure. The indicators point to higher prices in the near term, and to confirm the current support at 20.00, prices need to take out 100 DMA at 20.40 first. A break above this level towards 21.00 would confirm the strong bullish momentum and a trend change. Conversely, appetite for prices below the 10 DMA at 19.49 could trigger a test of 19.21; tertiary support stands at 40 DMA at 19.02. A positive candle with a longer lower wick suggests a growing appetite on the upside. To confirm further gains, the 100 DMA resistance has to be broken above first.
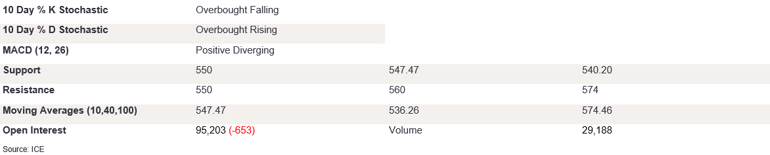
Ldn 2nd Month Sugar Futures

Ldn sugar strengthened on Friday, as moderate buying pressure triggered a close on the front foot at 574.30. The stochastics are rising into the overbought, with %K/%D diverging on the upside. The MACD diff is positive and diverging. A bullish candle with a long body and a longer lower wick suggests growing buying pressures; this could set the scene for higher prices to break above the 100 DMA level at 574.46. This would confirm the trend for rising prices, up to 580.70. On the downside, a breach of support at 10 DMA at 547.47 would strengthen the bearish momentum. This could also trigger losses towards 540.20. Indicators are showing a continuation of the trend on the upside, and if futures break above the near-term resistance at 100 DMA, we expect strong acceleration on the upside in the near term.
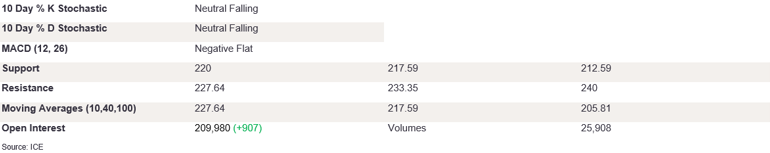
NY 2nd Month Coffee Futures

NY coffee futures held their nerve on Friday to close at 226.80. The stochastics are falling, with %K/%D diverging on the downside, which could suggest a change of momentum in the near term. The MACD diff is negative and flat, highlighting uncertainty for lower prices. To confirm further downside momentum, futures need to break below the robust support level of 220 to trigger the momentum to 40 DMA at 217.59. Prices would then need to take out the 100 DMA at 205.81 to confirm the longer-term downside trend. Conversely, appetite for prices above 10 DMA at 227.64 could trigger a test of resistance at 233.35. A dragonfly doji candle shows rejection of lower prices. While indicators suggest growing selling pressures, the 220 support has to be taken out first to confirm this. We expect futures to remain rangebound in the near term.
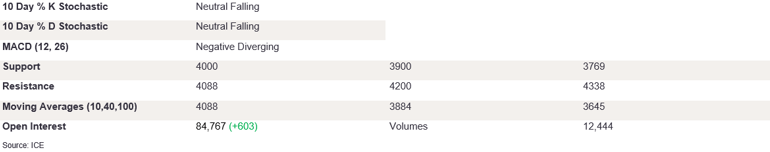
Ldn 2nd Month Coffee Futures

Ldn coffee futures edged lower on Friday after prices failed above the trendline once again, prompting a close at 4011. The stochastics are falling, with %K/%D edging towards the oversold, and the MACD diff is negative and diverging, confirming the outlook for lower prices. To confirm the bearish indicators, futures need to break below the support at 4000 and then target the 40 DMA level at 3884. On the upside, the 10 DMA level needs to be taken out before the test of 4200. We expect prices to weaken in the near term.
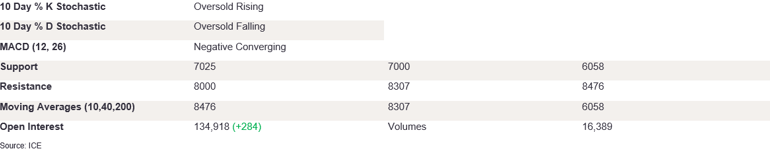
NY 2nd Month Cocoa Futures

NY cocoa futures opened lower but managed to close higher day-on-day at 7731. The stochastics are falling, but %K is seen tailing off on the upside in the oversold, which could suggest a change of momentum in the near term. The MACD diff is negative and converging, confirming the outlook. On the upside, futures need to break above the robust resistance levels of 8000 and then the 40 and 10 DMA levels at 8307 and 8476, respectively, to trigger the momentum on the upside. Conversely, appetite for prices below 7025 could trigger a test of support of 100 DMA. Candles have been range-bound in the last couple of sessions, so to confirm the indicators’ outlook on the upside, the futures have to break above the DMA levels first.
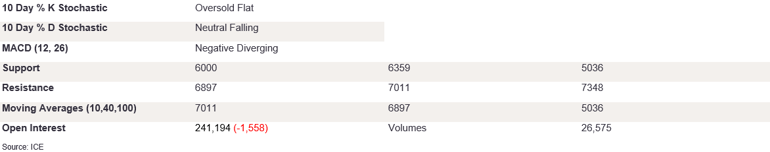
Ldn 2nd Month Cocoa Futures

Ldn cocoa futures opened lower on Friday but consolidated during the day, testing the support at 6000. The market closed at 6364. The %K/%D are about to enter the oversold territory but are showing signs of convergence on the upside. This could indicate a potential trend change in the near term. The MACD diff is negative and diverging, but the downside appetite is stalling. The indicators point to waning downside pressures, and to confirm the support, prices need to take out shorter-term DMAs at 7000. A break above these levels towards 7348 could confirm the strong bullish momentum. Conversely, appetite for prices below the 6000 level could trigger a test of support at 5359. Friday’s candle signals uncertainty about the outlook for lower prices, and if the futures continue to struggle below this level, we could see prices edge higher in the near term.