


Executive Summary
As the electric vehicle (EV) market continues to evolve, critical material prices and demand dynamics present significant implications for the industry and the broader clean energy landscape. Over the last two years, prices for essential EV materials - particularly nickel, cobalt, and lithium - have experienced a rapid decline, resulting in an EV battery price reduction of more than 25% for cathode materials globally. While the underlying factors influencing these pricing trends differ, they all share a common denominator – a slowdown of anticipated demand.
Nickel vs Cobalt vs Lithium Hydroxide Prices
Since the start of last year, the prices of critical materials have begun to decline, alleviating the pricing pressures on battery costs.
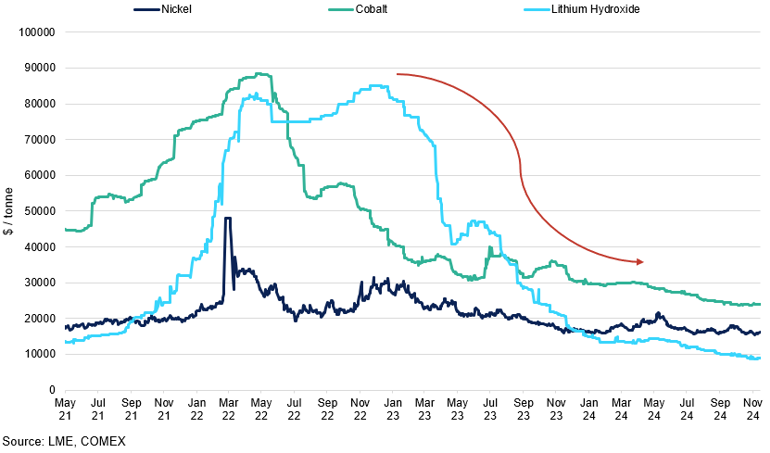
In 2022, supply shortages were the key reasons behind price spikes, prompting material prices to reach record highs, resulting in manufacturers actively sourcing materials that were believed to be in short-term supply. However, in 2024, this trend has changed. The lack of subsequent demand growth from the industry meant that easing supply conditions were met without the longer-term demand progress. This, coupled with an inventory overhand in the downstream sector (e.g. battery cells, cathodes), exerted downward pressure on prices. Since the beginning of 2023, lithium spot prices plummeted by 75%, while cobalt and nickel have each declined over 30%.
It is important to note that, despite slowing year-on-year growth figures, physical demand for critical materials has continued to grow. In 2023, lithium demand rose by 30%, with nickel, cobalt, and rare earth elements seeing demand growth ranging from 8-15%, according to IEA. Clean energy demand has emerged as the main driver of the overall demand growth. EVs consolidated their position as the largest-consuming segment for lithium, significantly increasing their share of the demand for nickel, cobalt and graphite. However, the pace of growth has not met market expectations for a significant surge in demand. In particular, the IEA's article in early 2023 expected a growth rate of 40% for lithium, but the realised growth was only 30%. Overinflated hopes for demand surges have not materialised.
"However, the pace of growth has not met market expectations for a significant surge in demand."
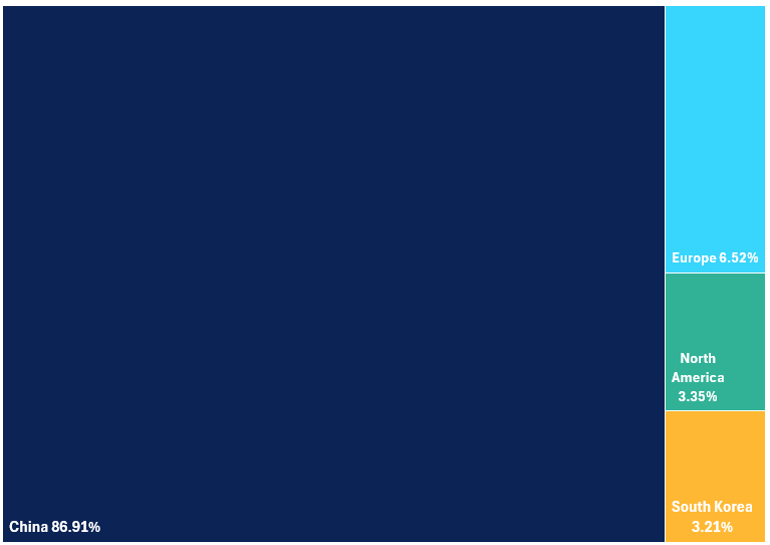
China Trade Flows from Battery to Production Stages for Lithium-ion batteries
China receives the majority of its own material necessary for the battery supply chain, achieving self-sufficiency.
While growth in the EV segment is anticipated to slow in the coming years, the longer-term outlook remains promising. In particular, mineral demand for clean energy technologies is expected to double between now and 2030, with lithium expected to see the most rapid growth due to rising EV battery needs. In this report, we cover the strategic importance of securing supply chains for these critical materials and the implications for future market developments.
Electric Vehicle Trends
In the first quarter of 2024, global electric vehicle (EV) sales reached approximately 3.2 million units, marking a 25% increase compared to the same period in 2023 (Counterpoint Research). China remains the key driver of this growth, with sales increasing by 31% YoY to nearly 1.9 million units. In North America, EV sales rose by 11.3%, reaching about 350,000 units. Meanwhile, the European Union and EFTA saw a modest 0.8% growth in Q1 and Q2, slightly outpacing overall car sales and maintaining EV market share at similar levels to the previous year. Smaller EV markets grew by 21%, driven by Chinese exports boosting sales in regions such as Southeast Asia and Latin America. With first-quarter EV sales typically representing 15%-20% of annual global sales, the International Energy Agency (IEA) estimates that EV sales could surpass 17 million units by the end of 2024, up from 14 million in 2023.
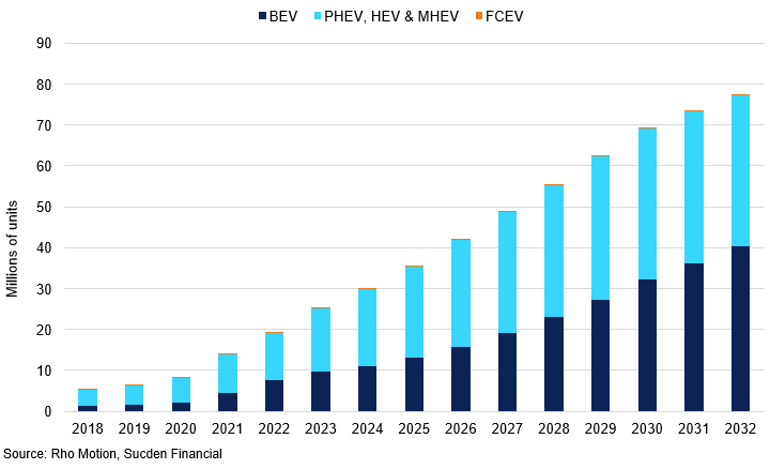
Global Annual BEV, Hybrid and FCEV Sales: 2023 Actuals and 2024-2032 Projections
Hybrids lead the market growth while FCEVs are projected to remain niche through 2032.
China’s contribution to global EV sales reflects its continued transition into mass-market adoption. Battery-powered vehicles are expected to account for over 23% of all passenger car sales in 2024 (IEA). Historically, Chinese automakers lagged behind their global counterparts in the automotive sector. However, they have now surged ahead in the EV market. With over 200 EV manufacturers, China has developed far more production capacity than its domestic market can absorb. This has resulted in growing inventories, fierce price wars at home, and increased efforts to expand exports to Southeast Asia, the Middle East, and Latin America.
The IEA reports that in 2023, China utilized less than 40% of its maximum cell output, while its installed manufacturing capacity for cathode and anode active materials was nearly four and nine times greater, respectively, than global EV cell demand. Given the scale and reach of Chinese EV makers, it is challenging for producers in other countries, who operate with tighter budgets, to compete effectively. The energy efficiency, range, and reliability of Chinese EV batteries have significantly improved in recent years, along with advancements in overall design, infotainment systems, and autonomy capabilities. This progress enabled BYD to surpass Tesla in global sales of fully electric cars for the first time in Q3 2023.
BYD, based in Shenzhen—the hub of China's electronics industry—has seen its sales grow by about a million cars annually for the past two years, with over 80% of these sales occurring in China. The last automaker to achieve such growth in a single year in the American market was General Motors in 1946, following a four-year suspension of passenger car sales due to World War II. Chinese carmakers have benefited from state support, improved quality, robust domestic sales momentum, and emerging opportunities in overseas markets. This has given them a strong sense of assurance, enabling them to persevere rather than consolidate or exit the market, confident in their ability to outlast competitors.
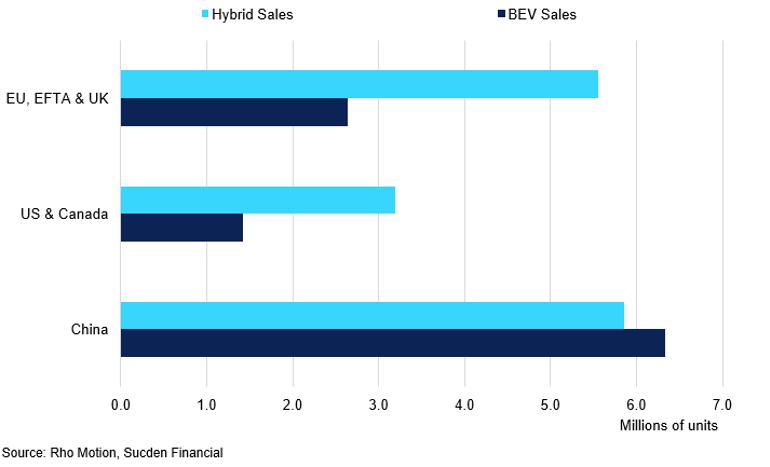
2024 Projected BEV and Hybrid Sales in Europe, North America and China
China leads in BEV sales.
Europe’s slower growth in EV sales can be partially attributed to Germany, the bloc’s largest EV market. In December 2023, Germany ended subsidies for EV production as part of a last-minute 2024 budget deal. Additionally, market saturation in Norway, where nine out of ten new vehicles sold are electric compared to an average of three out of ten in the rest of Europe, has also contributed to the slowdown. As Norway’s growth falters, it impacts Europe’s overall numbers. Amid these challenges, Spain and the UK have emerged as notable success stories in the European EV market. Both countries recorded strong growth in BEV sales, each achieving a 20% YoY increase in Q3 2024. The UK’s success has been bolstered by the introduction of the Zero Emission Vehicle mandate, which has helped BEVs achieve a market share of 20% in September 2024.
In 2024, the United States is expected to see a 20% increase in electric car sales compared to 2023, resulting in an additional half a million vehicles sold. Although 2023 ended on a challenging note for the electric car market in the US, the forecast remains positive for 2024, with electric vehicles projected to account for approximately one out of every nine cars sold. This optimistic outlook is partly driven by incentives from the Biden administration, aimed at accelerating the adoption of electric vehicles through tax credits, infrastructure investments, and support for domestic battery production.
Regulatory Updates
United States
As Donald Trump prepares to return to office following his recent election victory, many are now turning their attention to how his administration will handle the policies implemented under President Biden. Biden’s tenure was marked by a strong emphasis on industrial policy, with key initiatives designed to enhance US competitiveness in the green energy sector. Electric vehicles, critical minerals, and the regulations surrounding them became central to discussions about reshaping the US economy.
Biden’s administration introduced major legislative measures aimed at reshaping the US industrial landscape. The Inflation Reduction Act sought to accelerate the adoption of EVs by providing tax credits for models manufactured in North America, thereby incentivizing both production and consumer demand. The CHIPS and Science Act, meanwhile, was designed to attract semiconductor manufacturers to the US by offering federal funding for domestic microchip manufacturing and research and development, alongside a 25% tax credit for both US-based and foreign companies operating within the country. Together, these policies aimed to reduce reliance on foreign supply chains, particularly in critical sectors, while bolstering domestic production capabilities. This approach was shaped by a broader context of de-globalization, influenced by supply chain disruptions during the pandemic and escalating geopolitical tensions, including the potential for a Taiwan-China conflict. Policymakers further accelerated the US-led trend toward reshoring as they worked to address vulnerabilities and safeguard critical industries from external risks.
US Tariffs on Chinese Goods Across Presidential Terms
The Trump administration is likely to implement further tariff measures on Chinee export materials in the next 4 years.
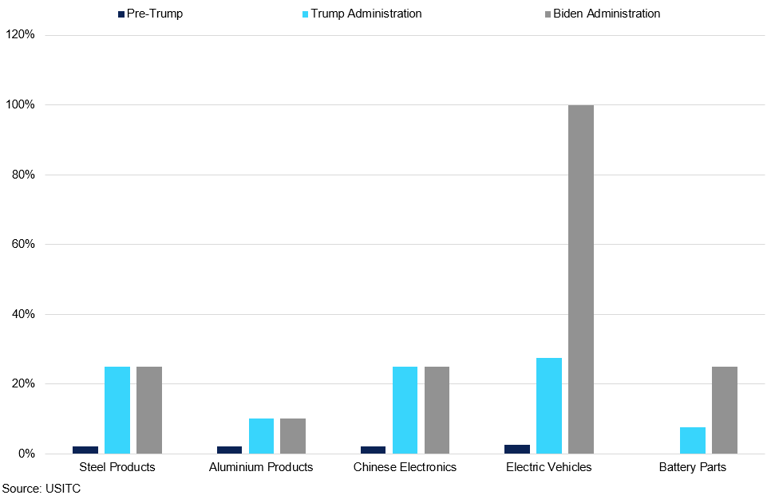
The Biden administration also sought to limit reliance on Chinese imports in critical industries. In May 2024, new tariffs were announced on imports from China, building on those first imposed during Trump’s initial term. These tariffs target sectors such as semiconductors (increased from 25% to 50%), EV batteries (from 7.5% to 25%), and electric vehicles (from 25% to 100%). The high duties appeared designed to deter Chinese manufacturers from entering the US market. However, their impact has been relatively limited, as many of these imports were already subject to substantial duties and regulatory restrictions. For example, according to Chinese customs data, only 1,700 Chinese EVs were imported into the US in Q1 2024, representing just 1% of all US EV imports. The new tariffs cover a modest $18 billion worth of imports from China, a small fraction compared to the total US imports from China, which reached $427.2 billion in 2023 (Bureau of Economic Analysis).
China has likely anticipated these trade restrictions and responded by redirecting investment to third-party markets, such as Mexico, to circumvent US tariffs. By leveraging trade agreements, Chinese manufacturers aim to maintain access to the US market while avoiding penalties associated with direct imports. This approach aligns with the deeply interconnected North American supply chains, where approximately half of US auto production already occurs in Mexico. By establishing production facilities in countries with favourable trade agreements, Chinese companies can indirectly supply the US market without incurring additional costs. These efforts include plans to develop EV battery plants in regions with existing agreements, further embedding themselves in the supply chains of US trade partners.
"By establishing production facilities in countries with favourable trade agreements, Chinese companies can indirectly supply the US market without incurring additional costs."
Now, as Trump prepares to take office, questions are mounting about how his administration will address these challenges. While Trump is widely expected to maintain a protectionist stance in industrial policy, his leadership style suggests a preference for unilateral measures over collaboration with trade partners. This raises uncertainty about the future of Biden-era initiatives, such as EV tax credits and clean energy investments, and whether they will be modified, or dismantled entirely. These decisions will have significant implications for the trajectory of the green energy transition in the US and the global competitiveness of its automotive and technology sectors.
European Union
After a nearly year-long inquiry into suspected unfair state subsidies for Chinese EVs, the European Commission officially imposed additional tariffs on October 30, 2024. These tariffs are intended to counter advantages that the EU claims are provided to Chinese manufacturers, including preferential financing, government grants, and access to land, batteries, and raw materials at below-market rates. This move follows a sharp rise in European imports of Chinese EVs, which more than doubled between 2021 and 2023 to exceed 430,000 vehicles annually, with a total value of €10 billion, according to the Peterson Institute for International Economics.
The European Commission's plan introduced five tiers of tariffs, determined by the level of state support identified across supply chains and the degree of cooperation shown during the investigation. EV manufacturers that cooperated with EU investigators face a 21% tariff, while those that did not face rates as high as 38.1%. BYD brands, including the Dolphin and Seal models, face a 17.4% duty, Geely a 20% tariff, and SAIC—the owner of MG—a top tariff of 38.1%. These additional tariffs are expected to increase the price of a €30,000 entry-level BYD vehicle by approximately €5,250.
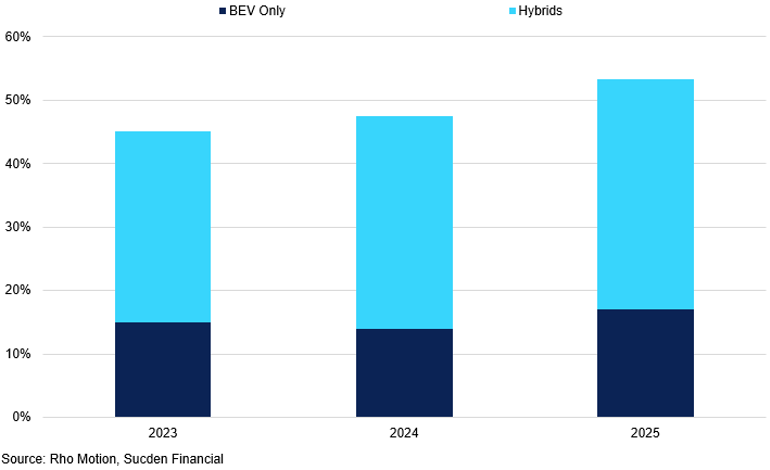
EU, EFTA & UK BEV vs Hybrids Penetration Rates: 2023 Actuals and 2024-2025 Projections.
BEV penetration stagnates while hybrid rates are expected to increase further.
Despite the tariffs taking effect, negotiations between the EU and China remain ongoing, reflecting the bloc’s efforts to avoid escalating the trade conflict. European automakers, particularly in Germany, are deeply concerned about potential retaliation from China. Unlike the US, where the automotive industry is less dependent on the Chinese market, European carmakers rely heavily on China both as a supplier and a consumer market. For example, Volkswagen, Europe’s largest automaker, operates a joint venture with SAIC and counts China as a cornerstone of its global strategy. Chancellor Olaf Scholz has noted that nearly half of the EVs imported from China into the EU were produced by Western manufacturers. Meanwhile, China remains the EU’s third-largest export market for vehicles, following the US and the UK, with 11,499 EVs worth €852 million exported to China in 2023.
The economic backdrop of this trade dispute adds another layer of complexity. The Eurozone economy is grappling with stagnation and inflationary pressures, leaving it ill-prepared for a full-blown trade war with China, akin to what has occurred between the US and China. EU officials have expressed a clear preference for reaching a resolution to avoid additional strain on the bloc’s economy.
In this context, the EU appears to be adopting a more strategic approach to trade policy. While the tariffs are a defensive measure, they also serve as leverage to encourage Chinese EV manufacturers to establish production within Europe. By fostering joint ventures and technological exchange, the EU aims to integrate more of the EV supply chain into its own borders. Historically, the EU criticized China’s demands for joint ventures and technology sharing as forced technology transfer. However, the current concern is not the loss of technology to China but rather the risk of Europe falling behind in the EV industry. Encouraging Chinese manufacturers to set up assembly plants and other production facilities within Europe could ensure greater competitiveness while mitigating dependency on imports.
Supply Chain Analysis
Mining
While electric cars are generally considered more environmentally friendly than traditional cars, the production of a battery and its associated systems for a small EV requires over 200kgs of materials - more than five times the amount needed for a conventional car. As demand for critical materials continues to rise with the growth of EV production, the complexities of the battery supply chain present significant challenges in this transition. As mentioned in our previous report, key battery materials are concentrated in a limited number of countries, each plagued with unique challenges that make sourcing from these regions riskier and more volatile. This over-reliance on upstream supply chains leaves automotive production vulnerable to shocks such as price volatility, geopolitical risks and protectionist measures imposed by governments. Although securing these materials through long-term agreements is one potential solution, we are seeing a trend toward rapid changes in battery chemistries aimed at reducing dependence on hard-to-source supplies. This has been particularly the case for cobalt, which has faced significant demand reduction as manufacturers shifted towards nickel-rich formulations that minimise the use of this metal. For a detailed analysis of each metal's supply and demand dynamics, please refer to our previous report.
"This over-reliance on upstream supply chains leaves automotive production vulnerable to shocks such as price volatility, geopolitical risks and protectionist measures imposed by governments."
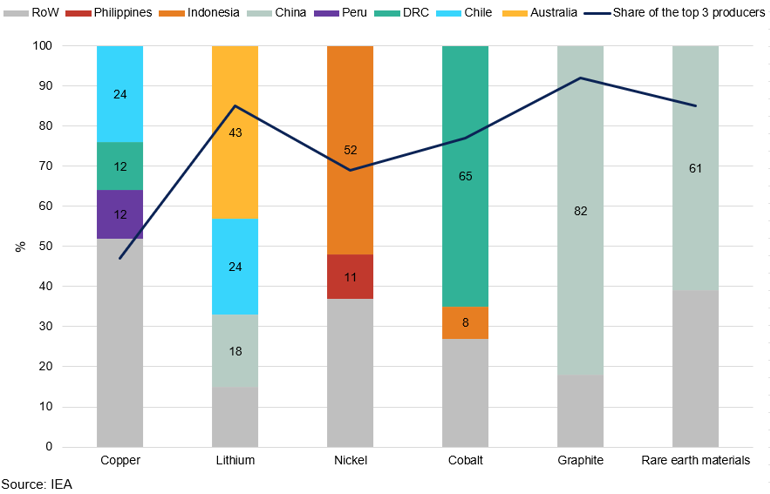
Geographical Distribution of Mined or Raw Material Production vs the % Share of the Top 3 Producers
Critical mineral space is controlled by a number of key producers.
As a result, many governments have grown increasingly concerned about vulnerability to supply disruptions, prompting the enactment of policies to incentivise domestic production. Recently announced legislation in the US, Europe, and elsewhere mandates minimum percentages of domestic manufacturing or sourcing from allied countries (such as those involved in free trade agreement in the US context) to meet regulations aimed at reducing carbon footprint. Policy initiatives include the Inflation Reduction Act in the US and the European Union’s Green Deal, both designed to promote local production and sourcing. Examples of expanded production efforts include the establishment of battery manufacturing plants by companies like Tesla and Northvolt in the US and Europe, respectively, as well as investments in domestic lithium mining operations.
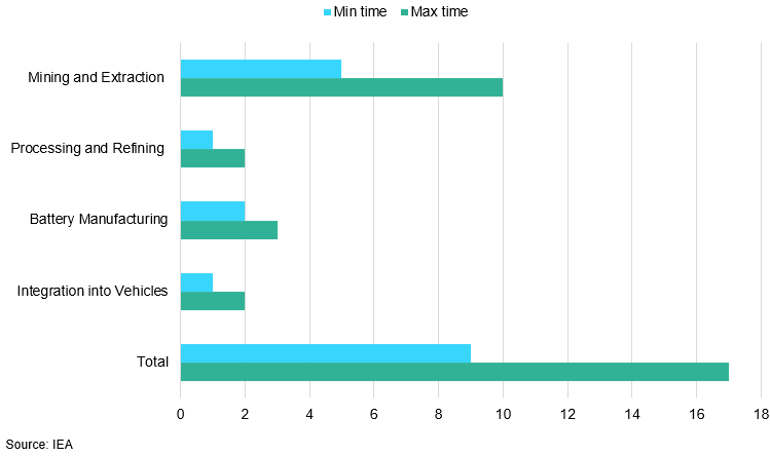
As of 2024, Western economies make a minimal contribution to upstream processes, which presents a challenge in managing and controlling the environmental impacts of mining and refining. Sourcing decisions—particularly regarding the type of energy used—have a large impact on emissions, depending on whether renewable energies or fossil fuels like natural gas are utilised. Therefore, the emissions regulations imposed by consumer economies on mining and refining processes in producing nations often fall outside their control, creating tension between supply and demand requirements. The best course of action lies in increasing investments, especially in new mining ventures. However, it is important to note that lead times in mining are considerably longer than in other segments of the supply chain, often requiring more than a decade from discovery to production and then several more years to reach nominal production capacity.
Minimum and Maximum Lead Time from Mining to Profit
On average, it takes 12 years to turn an ore deposit into a profitable mine.
The geographical distribution of mined material is unlikely to change significantly in the near term given today’s project pipeline. However, when comparing current mining production to mineral reserves, there is significant unrealised potential for diversifying extraction in the longer term. In particular, Australia, already the largest lithium producer, holds the joint largest reserves of nickel, alongside Indonesia, with 22% of global reserves. Yet, Australia currently contributes only 6% of current global production. Additionally, Australia possesses the second-largest reserves of cobalt, accounting for nearly 20%, while contributing a mere 3% of current production. This underscores the critical need for strategic investments in mining operations to harness these untapped resources and secure a more sustainable supply chain for the future.
Raw Material Processing
Electric vehicle batteries require high-purity materials, necessitating significant refining to achieve the quality needed for battery chemical precursors. This refining process is the most GHG intensive stage of the supply chain.
In terms of geographical distribution, China dominates the refining stage of the EV battery supply chain, accounting for approximately 90% of global production capacity. In 2022, the region processed a substantial share of the world’s key battery materials, including:
- Lithium: 65%
- Cobalt: 74%
- Graphite: 100%
- Copper: 42%
The processing of these materials is critical for China to meet its own demand for lithium-ion (Li-on) batteries. As a result, it also leads the global Li-on production race, capturing 57% of the global share. With excess battery-making capacity, China can produce cells at a fraction of the cost compared to Europe, creating significant opportunities for exporting midstream output to consumer economies. However, tariffs and trade restrictions complicate this dynamic. Consequently, the highest concentration of refined materials is found in China, posing challenges for many Western producers.
In comparison, while Europe is responsible for over 25% of EV production, it holds minimal stakes in the rest of the supply chain, apart from cobalt processing, which stands at 20%, according to the IEA. The US plays a smaller role in the global EV battery supply chain, with only 10% of EV production and 7% of battery production capacity. A new wave of battery manufacturers is emerging in Europe and North America, although most are currently in the planning or scaling stages. Meanwhile, South Korea and Japan hold substantial shares in downstream segments of the supply chain, particularly in cathode and anode material production.
While Europe and the United States are making strides in EV production, their limited roles in the broader battery supply chain highlight a dependency on other regions, particularly Asia, for critical components. The emergence of new battery manufacturers in these regions is a positive development, but the current planning and scaling phases indicate that it will take time before they can significantly impact the supply chain.
Battery Cell Production – Chemistry Analysis
As we progress further down the supply chain, China’s dominance in battery cell manufacturing remains overwhelmingly significant relative to other economies. Given the higher ownership of raw materials, the world supply is currently vulnerable to disruptions in China for both key chemistries. In particular, 80% of NMC (nickel manganese cobalt) and 92% of LFP (lithium iron phosphate) cathodes rely on minerals that pass through China (Cheng et al., 2024). NMC specifically faces additional geographical risks due to concentrations of nickel, cobalt, and manganese sourced from a limited number of countries, primarily Democratic Republic of Congo, Russia, and Australia. This limited geographical sourcing increases the potential for disruption, making the combined vulnerability across multiple supply chain stages substantially greater than the risks associated with individual steps alone.
What remains unclear is the degree to which EV battery material supply chains are vulnerable to disruptions in China when considering all supply chain steps. According to Cheng et al. (2024), LFP battery material supply chains show a high level of vulnerability to disruptions in China, with dependency level exceeding 90% even in the most optimistic scenarios. Even if all cathode production were moved outside of China, around 71% of LFP cathode material would rely on lithium sourced from China.
Vulnerability Index for Different Chemistries on China
Many of the existing battery chemistries depend significantly on China's supply chain.
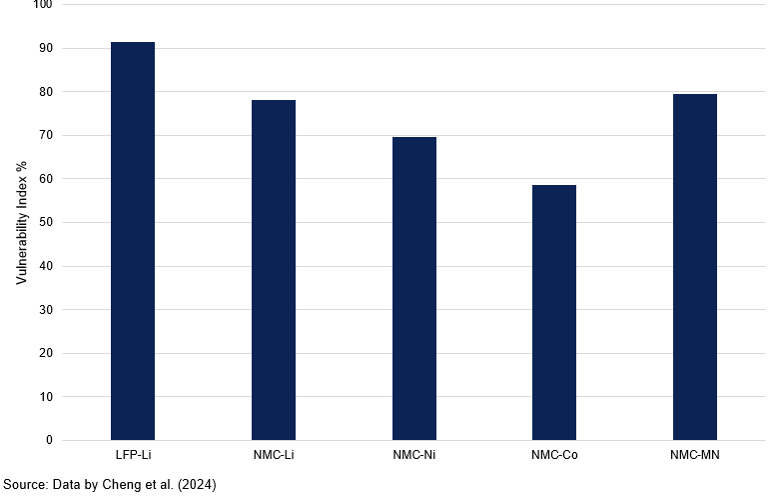
For NMC batteries, 57% of cathode production takes place in China, with South Korea and Japan supplying the rest. While the production geography of these cathodes is more diversified, the reliance on China’s mineral production remains substantial: roughly 50% of the refined lithium imported by South Korea and Japan originates from Chinese processing facilities. NMCs face a significant challenge due to four key materials that have high vulnerability indices related to China, putting its vulnerability index at 78%, which is 7% higher than of LFPs.
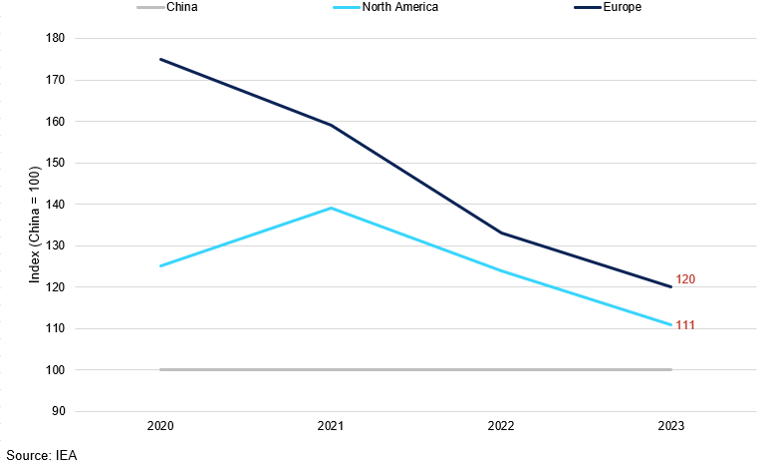
To add to China’s competitive edge, the nation has invested billions into battery manufacturing, resulting in a production capacity that far exceeds its domestic needs. Last year, China's cell manufacturing capacity was more than three times higher than domestic demand, and this figure is projected to increase to over six times by 2025, assuming all planned factories come online. This oversupply is the primary reason for the decline in LFP battery pack prices in China compared to the global market. According to BNEF, the average price of China's battery packs is $127/kWh, while prices in North America and Europe are 24% and 33% higher, respectively.
Battery Price Index by Region (China = 100)
Despite the decline in prices due to lower material costs, China's competitive advantage remains strong.
The nation's cost-effectiveness has been a key in driving a consumer-led demand surge, a trend that has not been prevalent in other major markets. In fact, regulatory support and requirements have been the primary catalysts for early market growth in economies like the US and Europe, but this enthusiasm is now beginning to diminish. This presents a dilemma: China must seek out a large export market to absorb its excess production, while Western manufacturers are increasingly pressured to distance themselves from Chinese products to enhance their competitiveness. We anticipate that much of the pressure from the US and EU will focus on diversifying the downstream battery supply chain, as it is nearly impossible to reduce dependence on China's mining and refining capabilities. This could lead to the implementation of tariffs designed to encourage the growth of local battery production and sourcing alternatives.
“This presents a dilemma: China must seek out a large export market to absorb its excess production, while Western manufacturers are increasingly pressured to distance themselves from Chinese products to enhance their competitiveness.”
By recognising the strategic significance of domestic EV battery production, the US has implemented several policies to strengthen supply chains and promote domestic manufacturing. The Infrastructure Investment and Jobs Act of 2021 allocated funding for critical minerals mining, processing, and research activities. In early 2022, the Biden administration invoked the Defence Production Act to encourage domestic battery investment and reduce dependence on imports. The Inflation Reduction Act then expanded and redefined EV purchase credits to require at least 40% of minerals in U.S.-made EV batteries be sourced domestically or from countries with free trade deals with the US. Likewise, across the Atlantic, the European Union's Critical Raw Materials Act requires that no more than 65% of the EU’s annual consumption of a raw material (for any processing stage) can come from any one country outside the region.
However, this indicates that, at least in the next couple of years, Western manufacturers will likely face a significant disadvantage compared to their Chinese competitors. At current rates, rising production costs are making EV prices less attractive to potential buyers despite falling costs of battery manufacturing globally. As of 2024, the EV trend appears to be losing momentum, with sales declining by approximately 6% in Europe and 4% in the US. This indicates a softening of demand as government subsidies decrease and consumers face higher costs than those in China.
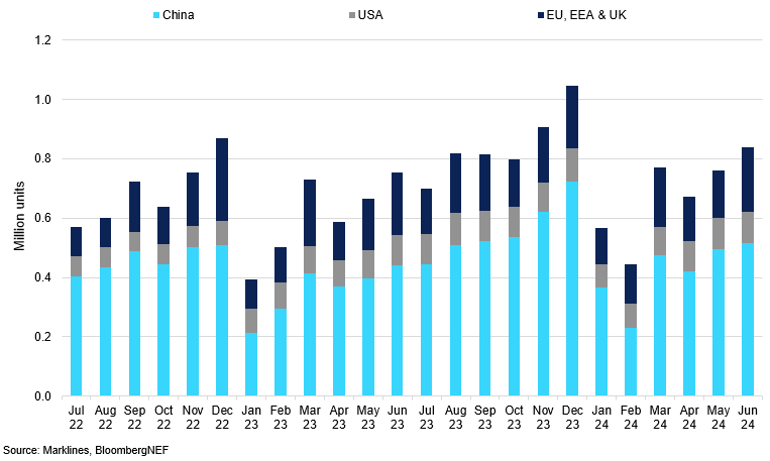
BEV Sales in China, US, and EU, EEA & UK
China’s sales growth continues to dominate the global trend.
Looking ahead, there is potential for a gradual shift away from reliance on China, but this transition will require several crucial steps.
Firstly, the construction of new battery-cell factories could ease some of the pressures posed by reliance on China, especially in light of the increased tariffs imported by both the US and EU on Chinese battery sales this year. However, establishing battery-cell factories is highly capital-intensive, which makes it unlikely to significantly reduce reliance on China in the near future. Building a single LFP battery factory costs approximately $850m in both the US and Germany. In contrast, the same factory would only cost about $650m in China, primarily due to the country's lower construction and labour expenses.
Secondly, the US and Europe currently produce more NMC batteries than LFPs due to their higher energy density. This makes them better suited for EVs that require longer ranges—a key consideration in the US and European markets. However, NMC battery technology alone is insufficient to meet these nations' long-term environmental goals. As a result of their lower critical material needs, LFPs can support a significantly larger number of EVs than current regulations anticipate by the end of the decade. Specifically, while NCA technology could potentially accommodate 400 million EVs, using LFP battery chemistry could enable the deployment of up to 990 million vehicles. In comparison, relying solely on NMC 111 would produce only 50 million vehicles. Moreover, current mineral production in the US can only yield about 5m EV batteries from 2027 to 2032, which is insufficient with the projected 10m batteries required under current scenarios. This means over 50% of the demand for EVs cannot be met due to mineral production limitations.
Instead, a more prominent solution might come from HEVs. The manufacturing of HEV batteries requires fewer specialty raw materials, alleviating mineral supply constraints. Moreover, HEVs offer substantially lower emissions relative to ICEVs for a similar vehicle price while also enjoying relative market popularity compared to EVs. Sales of HEVs vs EVs.
Electric Vehicle Manufacturing and the Impact of Tariffs
Due to a combination of rising tariffs on China, the comparatively high prices of Western EVs relative to Chinese models, and persistently elevated financing rates, EV production and sales in the US and Europe slowed this year. EV sales in the US grew by 21% and in the EU by 6.25%, both down significantly from the 40% and 18.5% growth seen in 2023. In contrast, China’s EV market maintained robust growth of 25%, marching its impressive performance from the previous year.
Market share of Chinese-made Cars in EU's BEV sales
Europe continues to heavily rely on Chinese-made cars.
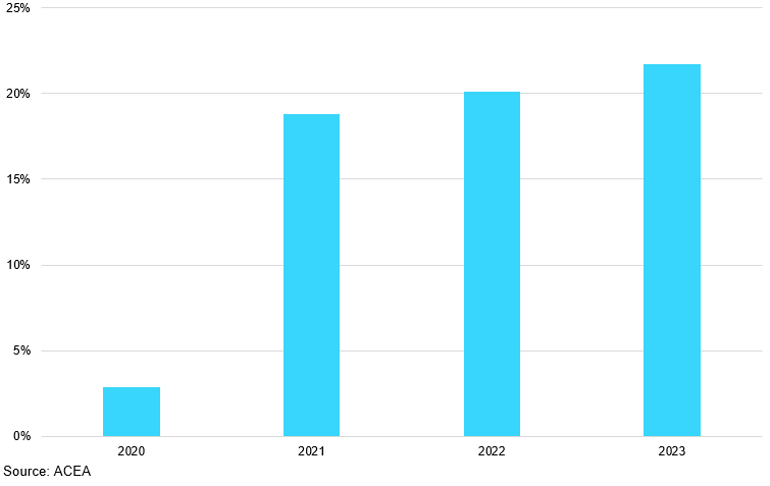
As of Q3 2024, Europe voted to impose tariffs as high as 45% on electric vehicles from China. The steps on EVs follow the US, which introduced a 100% duty on Chinese EV imports. The European Union’s move threatens to make imported alternatives even more expensive. Indeed, almost one-fifth of battery-electric vehicles sold in the EU in 2023 were made in China, according to the Transport & Environment. That figure is set to rise to 25% this year. While this is benefitting Europe in terms of overreliance on China, the near-term outlook for the bloc’s sales remain bleak.
So far this year, several of the world’s largest manufacturers have dialled back on their production ambitions. Volkswagen cancelled plans for a €2 billion EV factory in Germany, while Ford, GM, and Tesla have slowed down plant investments. Both Stellantis and Mercedes-Benz have paused development on EV battery plants in Germany and Italy, with the latter stating its plans to extend the sales of ICE for longer than previously expected. High prices, elevated borrowing costs, subpar charging infrastructure, and muted growth prospects across Europe have weighed on consumer spending power, resulting in a lower sale growth across the segment. Manufacturers currently prioritise combustion-engine cars and expensive EVs with higher margins, contributing to a slowdown in sales, T&E said in a report released Thursday. They’re holding back more affordable models until tougher European Union CO2 limits kick in next year. Europe’s falling electric-vehicle sales are painful proof the market is not ready to stand on its own, putting governments on notice for more support until affordable EVs become a reality.
“Europe’s falling electric-vehicle sales are painful proof the market is not ready to stand on its own, putting governments on notice for more support until affordable EVs become a reality.”
One silver lining in this is the continued growth of HEVs that offer the benefits of cleaner vehicles without burdening buyers with unreasonable costs. While the uptick in PHEV demand helps keeps BNEF’s forecast for 2024 electric vehicle sales broadly in line with what was expected in previous years, the rate of growth in the next four years is expected to average 21% annually, compared to 61% between 2020 and 2023.
Recycling
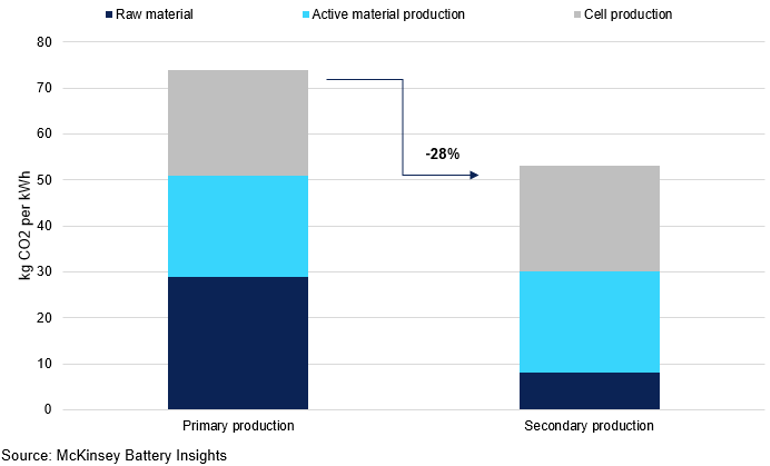
While an average EV achieves 50-70% lower lifetime emissions than a traditional ICE vehicle, its production emissions are almost double. Producing a typical EV with a 75-kWh battery pack releases over 7 tonnes of CO₂ solely from the battery, accounting for more than 30% of the overall emissions footprint in EV manufacturing. As mentioned in previous sections, mining and refining critical minerals contributes a significant share of the well-to-wheel emissions. While there are a number of factors that could help reduce mineral demand, including the use of low-mineral chemistries, battery recycling is currently the most efficient way of ensuring lower demand and emissions.
EV batteries have a long lifespan of 10 to 20 years, and at the end of their use, they still retain 70 to 80% of their capacity, meaning they can be repurposed at least once more. The industry has seen a continued regulatory focus on recycling techniques to promote the reuse of some of the emission-heavy materials, such as cobalt and lithium.
Total CO2 Battery Cell Production Emissions from Primary and Secondary Production
Secondary production of battery cell saves more than 25% of CO2.
In particular, the EU's Critical Raw materials act places a special requirement on recycling of critical minerals, by imposing a 15% recycling rate target for each critical raw material used within the EU. Alongside this, the EU has implemented new battery regulations alongside the Critical Raw Materials Act to enhance the sustainability measures of EVs and creating robust structure for battery policy. It mandates the vehicle manufacturers to collect retired batteries for reuse. Furthermore, recycling recovery rates are set to increase, requiring processes to achieve a 90% recovery for cobalt, nickel, and copper and 50% for lithium by 2027, with those rates rising even higher by 2031. Additionally, new batteries are required to contain a certain percentage of recycled materials, with targets established for cobalt, lithium, and nickel to increase significantly over the coming years.
Still the current landscape for recycling EV batteries presents significant challenges, as the market remains small due to limited end-of-life battery availability and various technological and economic obstacles, including life-cycle tracking, battery designs and mineral recovery rates. Although the U.S. is one of the three largest EV markets, the recycling capabilities do not adequately meet the anticipated demand. Projections by ABI Research indicate that US recycling plans will have the capacity to process batteries of 1.3m EVs annually by 2030. However, the actual number of end-of-life EV batteries available is expected to total 340,000 by that time, highlighting a substantial underutilisation of recycling infrastructure.