


Summary
As we enter the first quarter of 2025, trade tensions heavily influence market sentiment, with Trump’s tariffs narrative shaping the overall momentum. Volatility has gripped major asset classes – including FX, bonds, and equities – as markets attempt to gauge the scale, timing, and likelihood of these tariffs being fully implemented. We expect this volatility to persist throughout Q1 2025 amid ongoing trade uncertainty.
While the China-US relationship continues to deteriorate, with both sides implementing reflective 10% tariffs, the domestic picture in China is weighing on demand prospects. A lack of immediate demand in China is limiting the broader macroeconomic impact on metals prices, contributing to a growing disconnect between dollar and commodity markets.
While Chinese New Year holidays traditionally bring a quieter tone to the first quarter of the year, tariff announcements - such as a 10% tariff on Chinese imports and a 25% tariff on aluminium and steel - are injecting volatility into the overall complex. As we approach early March, the landscape will likely shift. A key catalyst at that point could be greater clarity on Trump’s trade policies, which may drive renewed market momentum.
Watch our Q1 2025 Metals Market Webinar
Aluminium
Aluminium prices held steady in Q4 2024 despite broader metal market weakness. Prices are expected to remain rangebound, but several factors could influence short-term spikes. Supply disruptions from alumina markets, the EU’s proposed ban on Russian aluminium, and escalating US tariffs on aluminium products may create volatility on the upside. However, more clarity is needed before the markets can completely price in the impact. At the very least, these factors could support aluminium prices at around $2,450/t.
Copper
Copper Prices fell in Q4 2024, closing below $9,000/t, driven by declining optimism in the Chinese economy despite earlier fiscal stimulus hopes. However, the sentiment shifted in February, as tariff threats widened the COMEX/LME arb, prompting a jump in copper prices to $9,500/t. Ongoing uncertainties, including potential US tariffs and muted demand from China, are expected to add price volatility in 2025. A moderately bullish market sentiment is expected to persist in Q1 2025 as a result.
Lead
Lead prices decreased to $1,950/t by year-end 2024, influenced by a bearish market narrative and speculative players holding record short positions. Despite a tight lead concentrate supply, the overall surplus is set to nearly double in 2025. However, with current prices below the $2,000/t levels, smelters will unlikely return to full capacity production following the holidays. This should tighten the availability of refined material, pushing domestic and LME prices higher.
Nickel
Nickel prices declined to $15,000/t by the end of Q4 2024, erasing early-year gains amid ample Indonesian supply and weak demand from stainless steel and EV battery sectors. In early 2025, we expect prices to remain rangebound between $15,000–$16,500/t, with persistent oversupply and rising LME inventories capping gains.
Tin
Tin prices remained subdued in Q4 2024, trading below $31,000/t amid weak demand and stable inventories. In early 2025, we expect prices to stay rangebound between $29,000–$31,000/t as supply risks from Indonesia and Myanmar fail to offset sluggish demand from the consumer electronics sector. While falling SHFE stocks and China’s shift to net tin imports could trigger short-term volatility, sustained price gains are unlikely without a more substantial demand recovery.
Zinc
In Q4 2024, zinc prices faced selling pressure. In January, this sentiment persisted, prompting a dip below the $2,800/t level due to disappointing market sentiment, especially regarding China. In the coming months, growing supply and declining demand in China’s construction sector will weigh on pricing prospects. Even tariffs are unlikely to boost appetite, as we do not expect them to affect the zinc market directly.
Iron Ore
Iron ore was one of the worst-performing industrial metals in 2024, driven by weak demand in China amid a stagnating economy and deflation concerns. Confidence in a post-pandemic recovery has waned, with new home starts declining over 20%, suppressing steel demand. Inventory levels are high, indicating ample supply. Despite tariff announcements on steel, a challenging recovery path in the Chinese economy are likely to weigh on iron ore prospects in the coming months.
Gold
Gold delivered a strong performance in 2024, closing nearly 27% higher and reaching an all-time high of $2,790/oz in October. The rally has continued into 2025, with gold breaking record highs almost daily since late January. We expect gold to remain well-supported, driven by geopolitical and macroeconomic uncertainty. However, tariff-related volatility and liquidity constraints could trigger sharp price swings. While the long-term outlook remains positive, short-term corrections cannot be ruled out as markets adjust to shifting conditions.
Silver
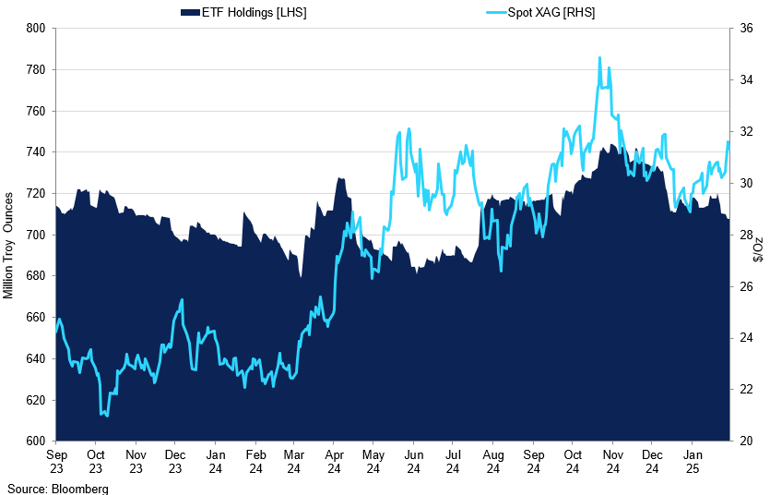
Silver underperformed relative to gold in 2024, trading between $30–32/oz, weighed down by softer investor interest and macroeconomic headwinds. In Q1 2025, we expect silver to remain rangebound, with price movements driven by industrial demand, particularly from the solar sector. While ETF outflows and weaker economic growth limit upside potential, substantial global solar expansion, led by China, provides long-term support.
Platinum
Platinum prices stabilised around $950/oz in late 2024, pressured by declining European automotive demand and modest supply growth from South Africa. In Q1 2025, we expect platinum to trade between $950–1,050/oz, with downside risks from falling diesel car sales and resilient supply. However, potential production curtailments in South Africa could offer some price support amid broader market weakness.
Palladium
Palladium remained under pressure in 2024, trading between $850–1,000/oz, as rising BEV and PHEV sales, especially in China, reduced autocatalyst demand. In Q1 2025, we expect prices to stay subdued due to structural demand declines and steady supply from Russia’s Nornickel. While potential supply disruptions could create short-term volatility, the long-term outlook remains bearish, with downside risks outweighing upside potential.
Macroeconomic Outlook
Global Economy
The first months of 2025 brought heightened market volatility, driven by a mix of factors that have added uncertainty for the year ahead. The new Trump administration, tariffs, inflation, economic growth, and monetary policy outlook are all major concerns weighing on market confidence. As a result, in Q1 2025, we have seen higher risk premiums priced in as investors brace for uncertainty – leading to increased volatility.
Major economies' CPI
Developed economies continue to face inflation stickiness as China battles deflationary pressures.
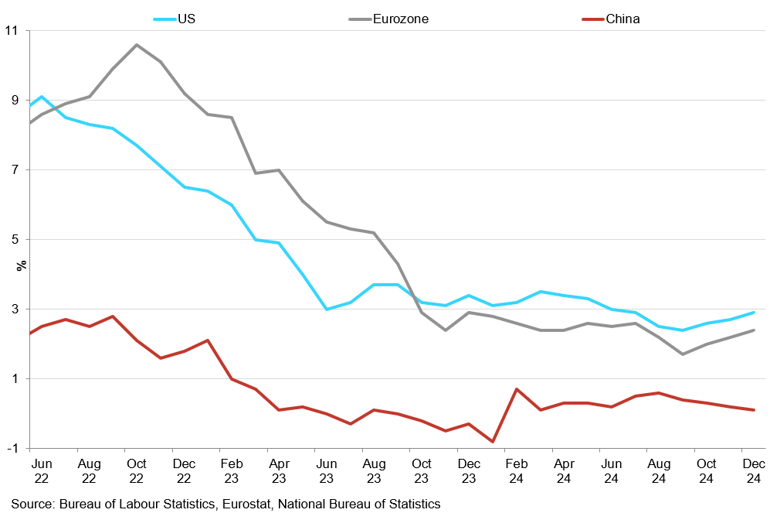
The recent tariff announcements from President Trump have sent waves through the markets, which are now digesting the implications of this news. As of February, Mexico, Canada, and China are in the spotlight due to the implementation of tariffs, and the spectre of potential retaliatory actions only adds uncertainty. While many of these decisions have now been delayed, especially those on Mexico and Canada, this backdrop of trade protectionism is generating inflationary pressures, contributing to elevated levels of the US dollar and yields. At the same time, the unpredictability surrounding Trump is prompting investors to seek refuge in safe havens, with gold benefitting the most amid the prevailing uncertainty, even in the face of a hawkish monetary policy.
Our main concern is that, given the current influence of the risks mentioned earlier, markets may be turning a blind eye to volatility shocks from ‘Black Swan’ events. Specifically, a sudden decline in growth and inflation figures later in the year could cause markets to reassess monetary policy actions, leading to a sell-off in yields. If economic growth falters, central banks can cut rates aggressively. In the meantime, we believe that market sentiment will be driven more by headlines than underlying economic reality, adding to volatility.
Oil
Oil futures started the year with a strong rally, driven by robust winter demand and supply risks amid fresh sanctions. In particular, at the beginning of January, the Biden administration implemented stricter sanctions targeting the oil sectors of Russia and Iran. As a result, both WTI and Brent crude oil gained more than 10% in the first two weeks of the year, reaching $79/bbl and $81.20/bbl, respectively. However, since then, a variety of factors have negatively impacted price performance, causing prices to completely offset the earlier gains.
Several key factors are contributing to a moderately bearish outlook for oil futures in the coming months. First, US crude oil inventories continue to grow, with an increase of 3.5 million barrels now in storage, marking the first rise in weeks. Additionally, trade uncertainties and tariff delays on Canadian energy products raise concerns about potential supply disruptions in the near term. President Trump had previously called for increased oil production to lower prices. Overall, these factors and lower demand from China are weighing on oil prices in the near term.
US
As we began 2025, all eyes were on Trump's inauguration. Since then, announcements regarding tariffs and speculations about potential retaliations have dominated the market narrative, inducing volatility in the FX, bond, and equity markets. The Biden administration maintained the existing tariff levels set by Trump in his first term. New rounds of tariff increases could further harm relationships with other countries and create supply chain bottlenecks. However, the lack of clarity regarding the direct impact of these tariffs makes it challenging for markets to accurately price these potential shifts, contributing to growing volatility. For now, a greater focus is being placed on the broader implications of Trump on the US's inflationary outlook over the long term. As a result, most hedging strategies are centred around US assets, such as bonds and the US dollar, which are seen as key instruments for navigating potential market volatility during his tenure.
University of michigan confidence vs 1-year inflation expectations
Inflationary expectations have picked up rapidly in recent months. 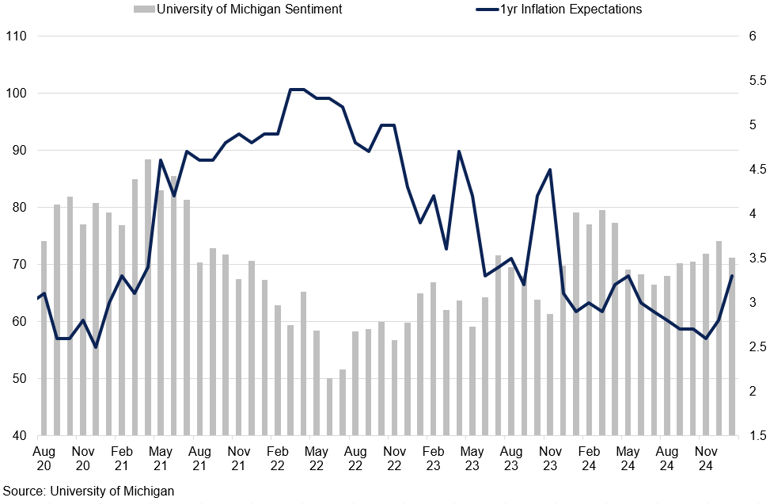
From the macroeconomic perspective, recent inflation data indicates that while food and oil prices contribute to fluctuations in headline inflation figures, persistent costs in services and shelter are keeping core inflation consistently elevated. In December, these metrics grew by 2.9% and 3.2% YoY, respectively. Although inflation is expected to ease further this year, the decline may be gradual, with a potential for reacceleration in the first half of 2025. By the second half of 2025, we expect these pressures to ease up slightly, allowing for a quicker pace of inflation softness.
The US economy remains relatively more resilient than other developed nations and significantly stronger than emerging markets. The US labour market, while gradually easing, remains historically robust, supported by steady job creation and strong wage growth. With employment conditions on solid footing and inflation proving stubborn, the Fed has room to cut rates less aggressively without compromising growth prospects. The US is holding the strongest position in financial markets, particularly as fiscal uncertainties in Europe, policy instability in key emerging markets, and slowing growth in China reinforce its status as a safe haven.
As a result, markets have repriced their expectations, now expecting 41bps worth of cuts in 2025. However, we maintain a moderately dovish stance, as signs of economic softening could emerge in the year's second half. We anticipate a 50-75bps reduction in interest rates from the Fed this year, which could provide much-needed relief for the housing market, borrowing conditions, and consumer spending, helping to sustain economic momentum while managing inflation risks.
In the meantime, we see limited downside for the US dollar, bolstered by Trump's leadership and the Fed's cautious stance. We believe that any sudden changes in current macroeconomic landscape or delays in tariff implementation could significantly impact market sentiment, leading to a temporary dollar weakness.
China
As 2025 begins, China faces a different start compared to previous years. Confidence in a post-pandemic recovery has largely faded as industries are struggling to rebound. The main concern remains on the inflation front. Consumer prices are stagnating, rising only by 0.1% vs. 2.0% before the pandemic, given falling prices in the transportation and housing sectors. Consumer purchasing power is weak, and a real estate slump continues to dent confidence, discouraging people from making big purchases.
China's house diffusion index vs completed investment in real estate
Construction indicators show that the segment has reached a plateau.
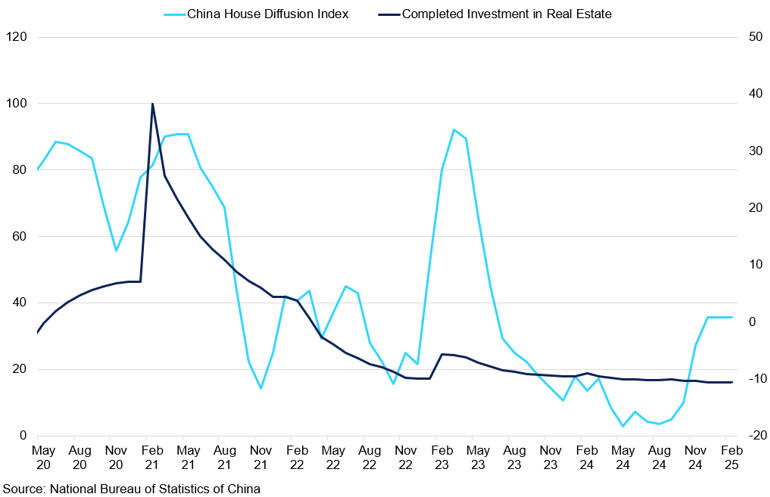
China's economic growth, while not as strong as it was before the pandemic, is still outpacing many developed nations with a 5% GDP growth rate and 5.3% YoY growth in consumer spending. Since the pandemic, China has entered a new phase of growth, shifting from a focus on industry to a consumer-driven economy, which is crucial for its development into a more advanced nation. While this transition may reignite growth in China in the long run, markets are likely to lower short-term expectations, impacting overall confidence. Moreover, the recently announced 10% tariff by the US on Chinese goods, along with China's expected retaliatory measures, is weighing on China's overall economic prospects. While we do not expect a 10% tariff alone to cause significant structural damage, fears of potential escalation are likely to increase uncertainty, further dampening China's outlook.
We expect that the government will continue to inject fiscal stimulus into the economy in addition to monetary policy easing; however, market optimism is likely to be muted. Instead, fiscal stimulus is expected to act as a buffer against further economic downturns. We expect that by H2 2025, China will reach a plateau, followed by a period of stabilisation and moderate recovery.
Eurozone
The European market has experienced significant uncertainty in recent months, brought in by political instability and ongoing economic challenges. In particular, recent government reshuffles in France and Germany have raised concerns over the political strength of the Eurozone's two largest economies, as continued disputes between left and right-wing parties are complicating expenditure plans for the coming years. Even with new administrations in place, several major European economies will continue to grapple with budget uncertainties. As of early 2025, at least four European countries have yet to submit viable budget plans, leaving the fiscal plans unsolved and adding to political risks.
eurozone pmi indicators
Lacklustre service is a drag on the overall PMI performance.
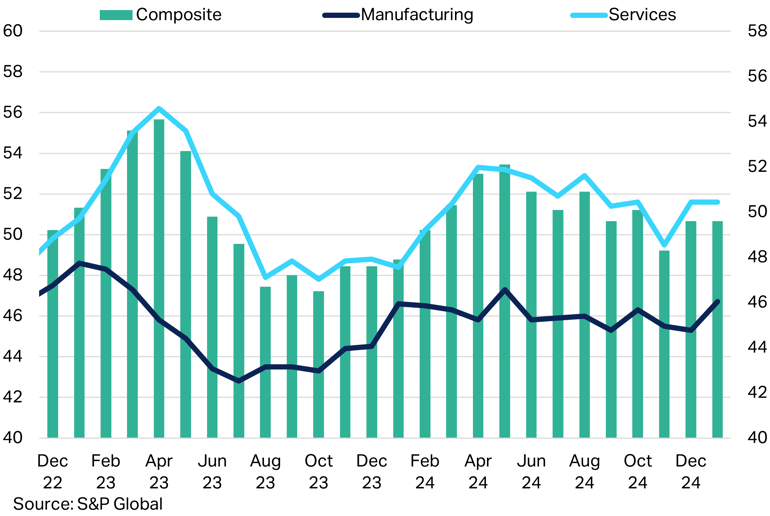 Additionally, Trump is creating significant uncertainty for the EU in 2025, with growing threats of tariffs on goods from the EU. With European elections approaching, the political and trade relationship with the US remains highly uncertain. Moreover, if additional tariffs on Europe are implemented, policymakers will have a limited set of tools to support the economy, which is heavily reliant on trade. The most significant tool available is the ability to cut interest rates, and if necessary, this should be implemented aggressively.
Since June 2024, the ECB has already implemented 160bps worth of cuts. While the ECB should cut rates faster than the Fed, the pace remains slower than previously expected. We expect another 25bps cut in its next meeting scheduled for March, with quarterly assessments thereafter.
Key Drivers for Q1 2025
- The ongoing disconnect between market fundamentals and metal prices persists. Despite Trump's announcement of a 10% increase in tariffs on all Chinese products as well as a 25% tariff on aluminium and steel, the base metals market has remained largely unaffected. This is largely due to the lack of clarity regarding how these tariffs will impact the trade fundamentals.
- In response to this uncertainty, China has front-loaded its exports in the final months of 2024, positioning itself to withstand a moderate tariff increase, such as an additional universal 10% tariff.
- With the Chinese New Year falling in Q1, we anticipate that metal markets will remain subdued even beyond the holidays, consistent with seasonal trends. The tariff threats are likely to amplify short-term volatility; however, the longer-term outlook remains relatively muted.
- In March, the dynamic is likely to shift due to increased market participation. By then, a major catalyst could come from greater clarity on Trump’s trade policies.
- Continued tightness in the fundamental concentrate space is making the market prone to exaggerate supply disruption signals, creating overextended short-term spikes.
Aluminium

Key Points
- Aluminium faces tighter market conditions than the rest of the complex due to proposed bans and tariffs.
- The subdued demand during the Chinese New Year holidays and afterwards is impacting longer-term price growth.
- Looking ahead, we expect prices to remain rangebound, with a potential for short-term spikes due to supply disruptions, followed by mean reversion.
Aluminium prices held steadily in Q4 2024, even as prices for other metals softened. Indeed, while the broader complex weakened due to a more robust US macroeconomic outlook, driving the US dollar index higher, aluminium held above the $2,500/t level. Aluminium is more susceptible to supply chain disruptions than other metals due to its highly concentrated geographical production. This makes the aluminium supply chain particularly vulnerable to geopolitical tensions and trade disruptions.
Recently, the EU proposed a ban on Russian aluminium imports. Initially, markets reacted positively to this news, but further information suggests that the impact may not be immediate. If approved, the ban would introduce a one-year phase-in period and a temporary exemption for "necessary" imports up to 275,000 metric tonnes, lessening the immediate pressures on supply. Moreover, over the past couple of years, EU imports of unwrought aluminium from Russia have been declining, dropping from 100,000 mt to 27,000 mt in August 2024 due to self-sanctioning by manufacturers. Instead, much of this material has been redirected to China, where imports have doubled from 2022. In the absence of Russian aluminium, European customers have alternative sources, including producers in the Middle East. However, aluminium from these regions typically has a higher carbon footprint, which contradicts the EU's climate goals. We anticipate that confirming these bans will lead to short-term price volatility; however, this is unlikely to derail the global market supply chain.
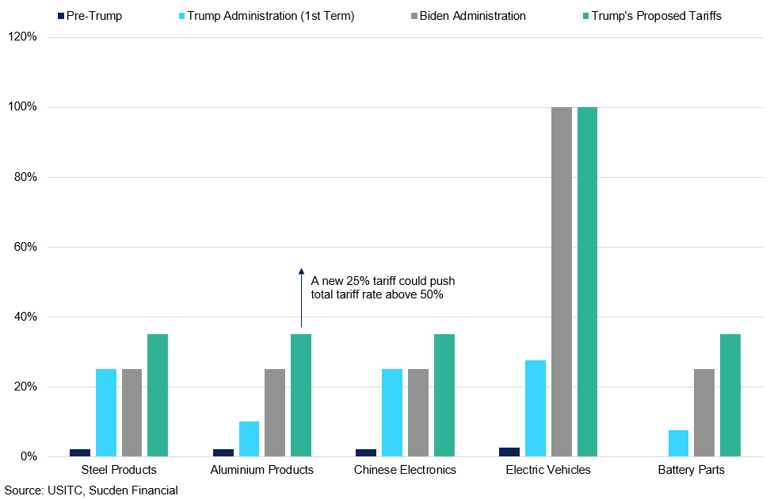
Concerns are growing regarding the potential impact of tariffs on aluminium imports into the US. In early February, the Trump administration introduced an additional 10% tariff on all imports from China as well as a 25% tariff on aluminium products. Notably, in May 2024, the Biden administration raised the tariff rate on China's aluminium to 25%, with planned increases scheduled in phases over the next three years. This change implies that the current tariff rate could reach 60% if implemented together. If implemented, this limits China’s exposure to the US markets, creating significant disruptions to major supply chains. However, due to a lack of clarity regarding tariff specifics, markets are becoming less sensitive to the likelihood of this occurring. Nevertheless, news headlines will be more influential than the actual reality, and markets will respond first and adjust to reality later.
US tariffs on chinese goods across presidential terms
The new 25% tariff suggests that the total tariff on aluminium products could reach 60% if all recent tariffs are enforced.
In China, aluminium output is hitting record highs, approaching Beijing's annual capacity cap of 45 million tonnes, with current production at 43 million tonnes. This is limiting the potential for further growth in Chinese production. Additionally, with tax rebates removed and ongoing concerns over elevated aluminium tariffs, China did as much export frontloading as it could. As a result, exports out of the region are likely to fall in the coming months.
The fundamental outlook also suggests weakening aluminium pressure. After a surge in prices last year, alumina prices have declined due to the resolution of production disruptions at Rio Tinto and South32 and expanding capacity in Indonesia and India. This led to a decrease in alumina prices by 30% in January. In 2025, we expect that growth in alumina supply will outpace demand, creating a surplus that could alleviate pressure on aluminium operating costs.
Q1 Outlook:
Aluminium prices have been largely rangebound in recent months and are likely to remain lacklustre even after the Lunar New Year celebrations. However, aluminium prices have an upside risk due to structural issues and the market's sensitivity to supply changes. Potential supply disruptions in the alumina market from Guinea, tariff threats, and a ban on Russian aluminium all contribute to the case for higher aluminium prices. These factors could provide support for aluminium prices at around $2,450/t.
Copper

Key points
- Copper gains are capped on the upside given a lack of confidence in Chinese economic recovery
- Despite continued concentrate shortages pressuring the TCs, a surplus of refined material prevents this from being reflected in prices.
- We expect market activity to pick up in March.
Copper prices weakened in Q4 2024, declining from highs of $10,000/t to finish the quarter below $9,000/t. By the end of Q3 2024, there was hope surrounding the recovery of the Chinese economy, fuelled by a record injection of fiscal stimulus. However, market sentiment has shifted since then, and there is now greater pessimism regarding the potential for strong growth in the region. As a result, we anticipate a period of volatility for copper prices in 2025, driven by this uncertainty. Nevertheless, the upside potential for the whole year will likely be limited to the range of $10,000/t to $10,500/t due to the lack of pressure on the refined balance and a lack of demand from China.
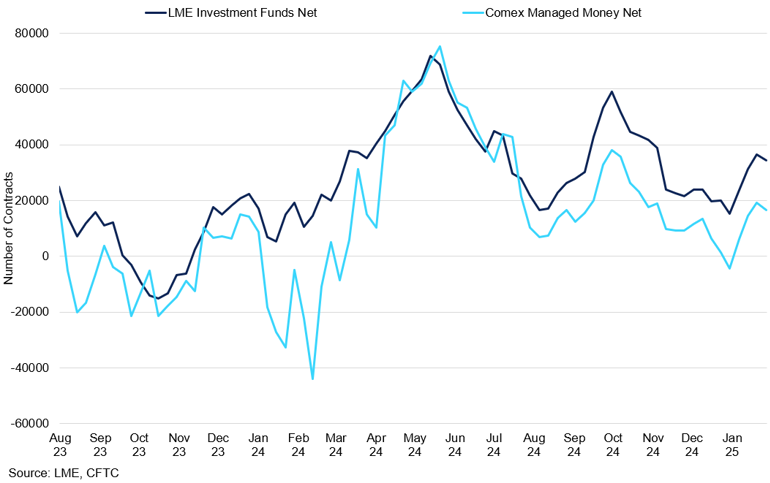
However, the COMEX market has reacted more strongly to these threats, resulting in a broader premium compared to the LME. There is a noticeable trend where uncertainty surrounding tariffs and policies is more prominently reflected in the COMEX market, mainly due to the influence of speculative traders. This prompted a rally in LME copper to $9,500/t in February. Due to ongoing trade policy uncertainties, we expect this differential to remain volatile in the coming months.
LME and COMEX Investment Side COT Net Positioning
The COMEX is likely to reflect tariff threats more so than the LME.
China's exports reached record levels in 2024 as supply from smelters expanded and demand from the manufacturing and construction sectors lagged. This surge in exports was partly driven by anticipation of sharp tariffs. However, exports are now expected to decline due to the implementation of higher tariffs and China's decision to remove export tax rebates for copper products and other commodities. With muted Chinese growth stalled by deflationary pressures, domestic copper demand remains weak. Although China has introduced several expansive policies to stimulate demand, prices have not risen significantly. The overall lacklustre mood across the complex will likely persist in Q1 2025, with copper playing a crucial role in driving the overall trend.
Despite ongoing fundamental tightness, the markets remain stagnant. Chinese treatment charges (TCs) have hovered near record lows for several months, yet this hasn't influenced final pricing. Refined production continues to remain in surplus, even amidst concentrate shortages. This is mainly because Chinese smelters can accept lower TCs due to their lower operating costs. While smaller smelters may be at a disadvantage due to thinner profit margins, the Chinese government recognises the strategic importance of the smelting industry. It provides various forms of support to maintain high levels of production. This support prioritises a steady supply of raw materials over favourable contracts. While smelter curtailments in 2025 are probable, we do not expect a substantial impact on the final refined balance figure.
Q1 Outlook:
With tariff threats being reflected in the COMEX/LME copper space, we anticipate a moderately bullish sentiment for Q1 2025. Notably, the announcement of a 25% tariff increase on aluminium and steel did not immediately affect prices on the day of the announcement. As a result, we anticipate greater sensitivity to such developments in the COMEX market, which should support a moderate upside in the LME. As a result, there may be more potential for upward spikes than for significant declines.
Lead

Key points
- With current prices below the $2,000/t levels, smelters will unlikely return to full capacity production following the holidays.
- This should tighten the availability of refined material in the meantime, pushing domestic and LME prices higher.
- That said, growing supply fundamentals are expected to cap upside potential, resulting in lower price volatility compared to 2024.
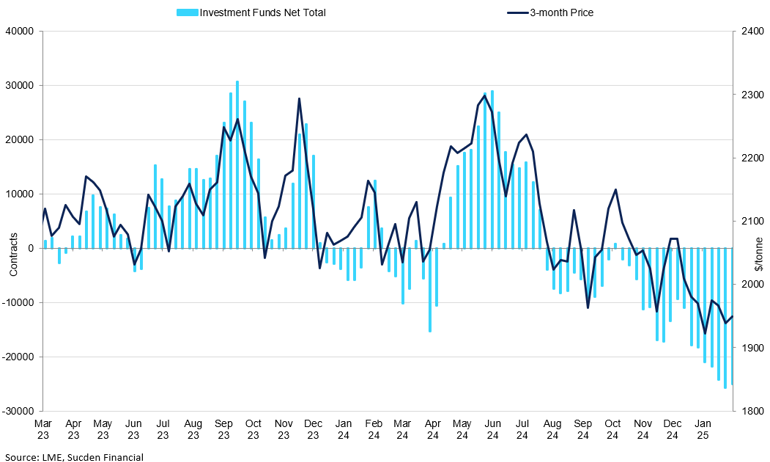
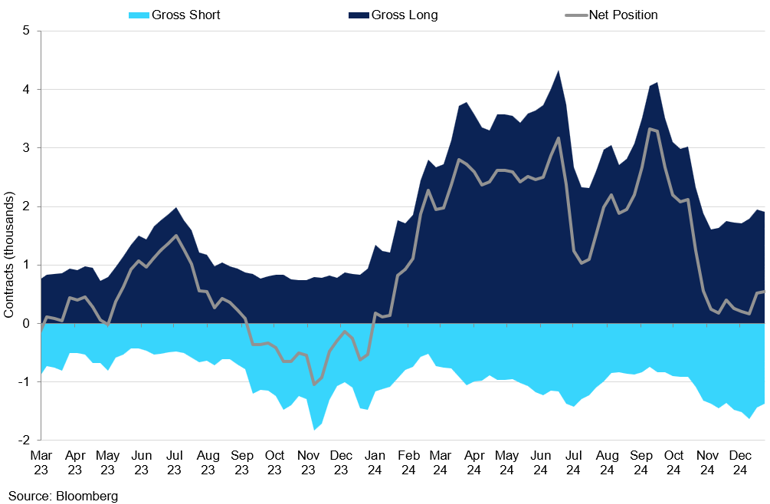
Lead continued to fluctuate in Q4 2024, but the prevailing longer-term downtrend ultimately drove prices 9.0% lower to $1,950/t by the year-end. While lead continues to mirror zinc’s moves during periods of strong directional appetite, the scale of lead’s moves is much shallower than zinc, limiting its volatility and, in turn, capping price performance within the range. At times of quiet market activity, lead is guided by technical indicators, with established trend support and resistance levels proving reliable. In recent weeks, the bearish narrative surrounding lead and zinc has intensified, with speculative players holding the shortest lead position since the series start in 2018. While this is affecting price performance, market momentum is starting to shift, and there are growing expectations for a rebound moving forward. However, the market needs a strong upward incentive to achieve this, which it currently lacks. Timing, in this case, is crucial.
Lead investment funds net total vs lme 3-month price
Speculative players hold the largest net short on record.
Moreover, the prevailing narrative of abundant lead supply limits the upside for prices. In line with zinc, lead’s balance is expected to widen further in 2025. According to ILZSG, the surplus is expected to nearly double from 63,000 tonnes to 121,000 tonnes this year, despite continued lead concentrate shortages in the market.
In 2024, the supply of lead concentrate was tight, TCs hit a record low, and battery scrap prices increased drastically, squeezing smelter profit margins. This supply constraint resulted in large-scale production cuts and suspensions at secondary lead smelters, disrupting the usual off- and on-peak seasons for downstream demand. Looking ahead to 2025, the lead concentrate balance is expected to remain tight. However, it is unlikely to move the metal outside its 2024 range, particularly since refined lead production remains steady.
The year’s first quarter is traditionally a quiet production period, marked by prolonged lower production rates in China. This, coupled with higher energy costs during the winter and a tight supply of battery scrap, is likely to lead smelters to remain under maintenance for a longer duration. Moreover, with current prices below $2,000/t, it is unprofitable for smelters to resume full capacity from the holidays. This should tighten the availability of refined material in the meantime, pushing domestic SHFE prices higher. While the LME may experience slight increases as well, these gains will not be proportional. As a result, we expect lead prices below $2,000/t will not be unsustainable in the meantime.
From the demand side, lead consumption in China is expected to rely heavily on policy support. Our base case is that the Chinese government will continue to support the economy through fiscal injections and monetary policy easing. In particular, we expect fiscal support to align with the levels seen in 2024. However, we do not expect this to be sufficient to drive a significant recovery in growth in the region. Instead, it is likely to provide a cushion against further declines in economic performance. We expect the Chinese economy to plateau this year, with gradual recovery anticipated in the latter parts of 2025 and into 2026.
Q1 Outlook:
We expect lead prices to stay rangebound in Q1 2025, with the broader downward trend continuing to exert pressure. However, prices below $2,000/t are likely unsustainable for smelter profitability, making a rebound above this level the more probable scenario. The market is expected to maintain its oscillating pattern as smelters adjust production to protect margins. That said, growing supply fundamentals are expected to cap upside potential, resulting in lower price volatility than in 2024.
Nickel

Key Points
- Nickel prices remain under pressure in early 2025 due to ample supply from Indonesia, a persistent global surplus, and sluggish demand from the stainless steel and EV battery sectors.
- Indonesia’s potential mining quota cuts could provide temporary price support, but any gains are likely to be short-lived given ongoing oversupply and weak demand recovery.
- LME inventories have risen to 173,000 tonnes, reflecting a continued surplus, with prices expected to trade between $15,000–$16,500 per tonne in Q1 2025, capped by $18,000/t resistance.
Nickel prices remain under pressure in early 2025, weighed down by ample supply from Indonesia and sluggish demand growth. After brief gains in early 2024, prices declined to the $15,000–$15,200 per tonne range by year-end, erasing earlier advances. The persistent global surplus, driven primarily by Indonesia’s expanding production, continues to cap price gains. Policy discussions in Indonesia have introduced new uncertainties, with the government considering significant mining quota reductions to support prices. While such supply cuts could tighten the market temporarily, any resulting price increases are expected to be short-lived due to the ongoing oversupply and weak demand recovery in key sectors such as stainless steel and EV batteries.
LME Ni Stocks vs Cancelled Warrants vs Ni Ore Inventory
The current inventory levels are the highest since 2021.
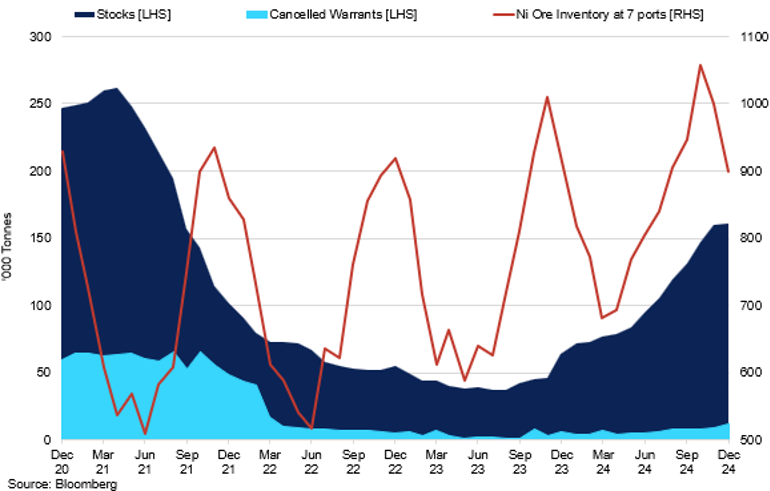
Nickel’s underperformance has been reinforced by continued weakness in demand from both the stainless steel and EV battery sectors. Despite initial optimism for a demand rebound, the stainless steel market remains under pressure, with low-grade production and falling prices of 200-series stainless steel in China limiting upside potential. Meanwhile, EV demand has fallen short of expectations, slowing nickel uptake in battery supply chains. LME nickel inventories reflect this ongoing imbalance, with stockpiles steadily increasing in recent months. By January 2025, LME inventories reached 173,000 tonnes, the highest level since 2021. This rising inventory signals a continued global surplus, which will likely keep LME nickel prices capped below the $18,000 per tonne resistance level.
Indonesia had previously approved annual mining quotas of 240 million metric tonnes until 2026, but a key development in early 2025 will be whether the government follows through on its proposal to reduce these quotas further to 150–200 million tonnes. A meaningful reduction in mining quotas could slow refined nickel production growth and help narrow the global surplus. However, Indonesia must balance price stabilization with economic priorities, as the nickel industry remains a major source of tax revenue and foreign investment, particularly from China. Aggressive quota cuts could create raw material shortages for domestic smelters, driving up domestic ore prices and increasing reliance on imports from the Philippines. Macquarie projects a 60,000-tonne global surplus in 2024, significantly lower than the 200,000-tonne surplus in 2023. If Indonesia proceeds with deep cuts, this surplus could narrow further, offering modest price support.
The combination of supply risks and geopolitical factors suggests potential short-term price volatility, particularly if Indonesia enacts mining restrictions or if demand from China shows unexpected strength. However, weak fundamentals are expected to limit any sustained rally. The ongoing Class II nickel surplus, fuelled by production growth in Indonesia and China, will likely maintain downward pressure on prices throughout early 2025.
Q1 Outlook:
Given these dynamics, the outlook for nickel remains cautious in early 2025, with further downside risks if demand fails to recover. Should Indonesia implement meaningful production cuts, prices could experience short-term spikes, though sustained gains remain unlikely without broader market rebalancing. We expect nickel to trade within a range of $15,000–$16,500 per tonne in Q1 2025, with any upside likely to be temporary. The $18,000 per tonne resistance level remains a key threshold, with the market unlikely to break above it due to persistent oversupply.
Tin

Key Points
- Tin prices will likely remain range-bound or under pressure in early 2025 due to weak demand, sufficient global inventories, and cautious speculative sentiment despite supply risks from Indonesia and Myanmar.
- China’s shift from a net exporter to a net importer of refined tin and declining SHFE inventories highlight tightening supply, but stable LME stocks prevent a significant price rally.
- Tin prices may face short-term volatility from potential supply shocks or a stronger-than-expected demand rebound. Still, without a significant recovery, prices are expected to trade between $29,000/t and $31,000/t in Q1 2025.
Tin prices will likely remain range-bound or under pressure in early 2025, as supply constraints fail to trigger a strong bullish response amid weak demand, moderating but still sufficient inventories, and cautious speculative sentiment. While production risks in Indonesia and Myanmar—two of the world’s top tin producers—could theoretically support prices, tin has remained subdued due to fragile consumption trends and globally manageable stock levels. The market remains caught between tightening supply risks and underwhelming demand recovery, resulting in a cautious price environment.
Tin investment funds cot positioning
The net position has declined significantly in recent months.
Indonesia’s long-standing ambition to restrict raw material exports in favour of domestic downstream processing remains a key policy risk for the tin market. Although no formal measures have been implemented, the government’s resource nationalism strategy, highlighted by the disruptive 2020 nickel ore export ban, continues to cast uncertainty over future tin supply. Meanwhile, Myanmar’s tin output faces persistent disruptions due to ongoing civil unrest, with a ban on new mining permits at one of the world’s largest tin deposits still in place. China, the main buyer of Myanmar’s concentrate, is feeling the impact, as reflected in a sharp decline in Shanghai Futures Exchange (ShFE) inventories—from a record 17,818 tonnes in mid-2024 to around 6,000–7,000 tonnes currently. Additionally, China has flipped from a net exporter to a net refined tin importer, underscoring regional supply dynamics shifts. However, LME stocks remain stable in the 4,000–5,000-tonne range, which has helped to prevent an outright supply squeeze and kept overall market sentiment cautious.
On the demand side, the outlook remains fragile heading into Q1 2025, particularly in consumer electronics, which accounts for 35–40% of global tin consumption. Despite a modest 3% recovery in 2024 following a sharp 3.9% contraction in 2023, this rebound has not been strong enough to drive sustained price gains. Ongoing weakness in PC and smartphone sales continues to weigh on tin consumption in solder applications. While new energy sectors—such as EVs, solar ribbon soldering, and AI-driven semiconductor growth—are expanding, they have not yet offset cyclical slowdowns in traditional sectors like consumer electronics and construction. This muted demand environment has prevented supply disruptions from translating into significant price rallies, with inventories remaining at manageable levels and reinforcing a cautious market tone as we enter 2025.
Q1 Outlook:
Despite lacklustre demand and cautious positioning, price volatility remains a key risk. The growing net short position raises the potential for a short squeeze, which could trigger sharp but temporary price spikes if unexpected supply shocks or macroeconomic surprises occur. Additionally, tin prices could face upside pressure if Indonesian or Myanmar supply tightens further or if China’s economy rebounds more strongly than anticipated. However, without a significant demand recovery, tin prices are expected to struggle to break out of their current range in Q1 2025, likely trading between $29,000/t and $31,000/t.
Zinc

Key Points
- Growing supply and declining demand in China's construction sector weigh on pricing prospects in the coming months.
- Even tariffs are unlikely to boost appetite, as we do not expect them to affect the zinc market directly.
- We expect zinc prices to remain subdued for the first couple of months of the year.
Zinc prices faced moderate selling pressure in Q4 2024, repeatedly testing the robust $3,000/t support level as markets digested Trump's presidential win and grew increasingly disappointed with China's policy support. In January, the downbeat sentiment intensified, prompting a breach of this support to $2,800/t – a September 2024 low. Since the start of this year, zinc has shown an increasing inverse correlation with USDCNH, with its link to SHFE more pronounced than LME, reinforcing the view that the Chinese market is driving zinc's momentum. The COT report reflects this shift, showing increasing selling pressure from commercials in recent weeks.
Looking ahead, we expect the dollar index to remain elevated despite potential short-term dips, weighing on CNH and, in turn, zinc's prospects. As a result, we do not foresee a significant breakthrough above the $3,200/t level in the coming months. While tariff threats loom over the base metals complex, we do not expect these to directly impact zinc. Instead, universal tariffs and indirect effects stemming from auto and electronics tariffs are more likely. These would positively impact prices, though the effect is expected to be minimal.
Furthermore, the fundamental outlook is also starting to exert pressure on zinc price expectations. After two years of deficits supporting price momentum, the refined material balance will shift into a surplus of 100,000 tonnes in 2025. This year would mark the start of a growing surplus trend that is expected to continue until the end of this decade. Global supply is projected to increase due to the lifting of mining suspensions in Latin America and additional capacity expansions in China, leading to a 5% YoY growth in refined material this year.
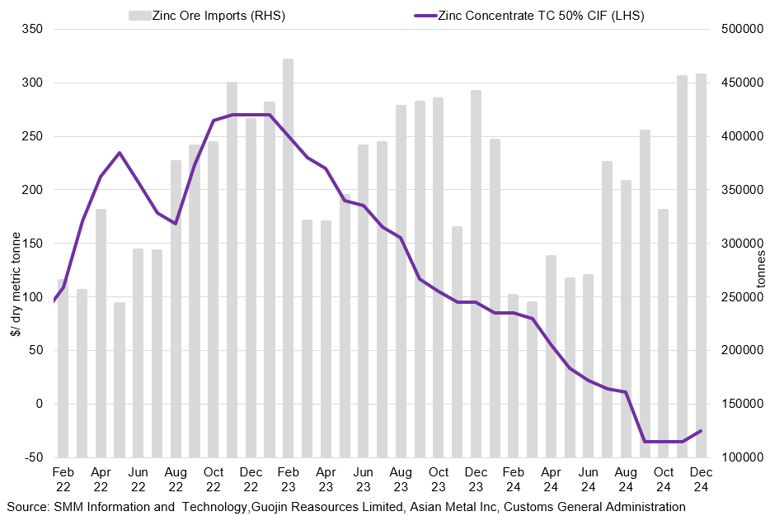
These developments are starting to be reflected in the fundamental indicators. The LME cash to 3-month spread continues to weaken, reaching -$50/t – the widest point since September, with spreads further down the curve at the lowest levels since the start of 2024. The impact of growing supply is also becoming evident in the treatment and refining space. As of December, TCs stood at -$25/mt, up from -$35/mt in September. Increasing mine supply and agreements among many Chinese smelters to postpone capacity expansion plans have helped reduce concentrate demand. We expect this trend to continue into 2025, which should alleviate some pressure on concentrate production. However, while we anticipate a recovery in TCs, the increases will likely be modest due to the ongoing shortage of concentrate.
China's zinc ore imports vs imported zinc TCs
Concentrate shortages are likely to weigh on TC recovery in 2025.
While China's construction industry accounts for 50% of zinc consumption, the underperformance in this sector is prompting a reassessment of growth strategies. China's trade-in policies encourage purchases of white goods to boost demand, potentially increasing refined zinc consumption by 1.7% YoY in 2025. Despite this, supply additions are expected to outpace demand, leading to a surplus of refined zinc, while raw material availability will remain slightly constrained in the coming years.
Q1 Outlook:
Given the limited threat of tariffs on zinc relative to other metals and the easing tightness in domestic fundamentals, we expect zinc prices to be capped on the upside for most of 2025. In Q1 2025, we anticipate little change in momentum, especially during the Chinese New Year, when downstream production rates are projected to be significantly lower. While there is a short-term upside risk due to speculative demand—particularly if copper prices rally—we do not expect this to establish a long-term upside trend. As a result, we expect zinc prices to remain subdued for the first couple of months of the year.
Iron Ore & Steel

Key Points
- Iron ore is a key indicator of confidence in the Chinese construction sector, which remains subdued.
- Although we anticipate that the construction sector has reached a plateau, the market sentiment remains bearish regarding potential recovery.
- With supply largely stable, lacklustre demand in China is expected to lead to a slight decrease in iron ore prices over the coming months.
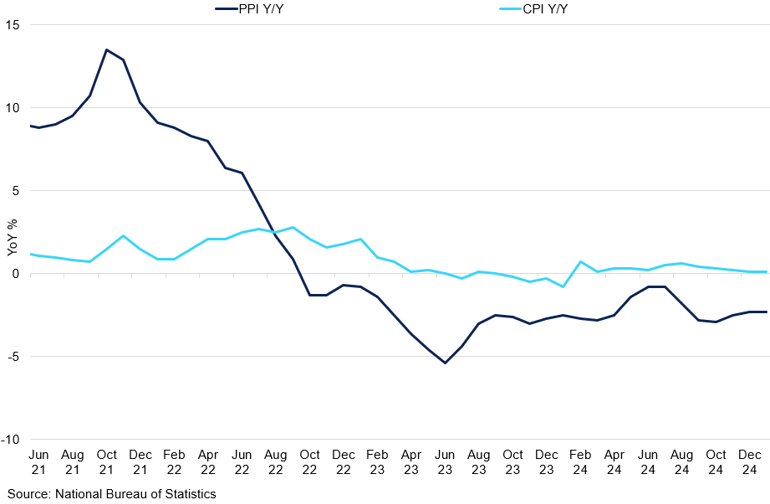
Iron ore was one of the worst-performing industrial metals in 2024, with prices falling by more than 10%. It is particularly sensitive to negative sentiments from China, leading to stronger downward pressure compared to non-ferrous metals. We expect this trend to persist. As 2025 begins, China is facing a different situation compared to previous years. Confidence in a post-pandemic recovery has significantly diminished as industries struggle to rebound. The primary concern continues to be inflation. Consumer prices are stagnating, rising only by 0.1% compared to 2.0% before the pandemic, largely due to declining prices in the transportation and housing sectors. Consumer purchasing power remains weak, and the ongoing real estate slump is further undermining confidence, discouraging people from making significant purchases. This environment continues to exert downward pressure on iron ore pricing, pushing prices below $100/mt.
The construction segment will play a crucial role in influencing iron ore's sentiment. China's new home starts have continued to fall, now down more than 20% year-to-date. This should continue to suppress steel demand in 2025. Recent stimulus policies have primarily focused on clearing property inventories rather than boosting new construction, which will limit their positive impact on steel demand. We expect that the government will continue to inject fiscal stimulus into the economy alongside easing monetary policy, but market optimism is likely to remain subdued. Instead, fiscal stimulus is expected to serve as a buffer against further economic downturns. By the second half of 2025, we project that China will reach a plateau, followed by a period of stabilisation and moderate recovery.
China CPI and PPI Performance
Deflationary measures are stalling growth prospects in China.
Moreover, increasing overseas production is widening the availability of supply in the face of muted demand. In the first half of the year, total iron ore production from the top four producers reached 259 million tonnes, a 1.4% increase compared to the same period in 2023. Low domestic prices and subdued demand have created opportunities for export growth. China's steel exports reached their highest levels since 2016, with volumes increasing by more than 20%. Additionally, the lack of immediate demand has become apparent in inventory levels; iron ore port holdings in China have continued to rise, exceeding 150 million tonnes and reaching their highest levels for this time of year, indicating an abundance of seaborne supplies.
Q1 Outlook:
With supply largely stable, demand in China will continue to drive iron ore prices going forward. With the recovery path for China still bumpy, markets should remain sensitive to Chinese policies, which may lead to price volatility. Until there are clear signs of a sustainable recovery and economic growth in China, it is unlikely that we will see a significant long-term increase in iron ore prices. This is especially prevalent given the recent Trump administration announcement of tariffs on steel. As a result, we do not expect the downside to be protracted. Still, we anticipate that the iron ore premium compared to other metals will increase in the coming months, with iron ore likely underperforming relative to the broader metals complex.
Gold

Key Points
- Gold remains strong, poised to retest record highs in Q1 2025, driven by safe-haven demand amid geopolitical and macroeconomic uncertainty.
- Central bank purchases, especially from Poland, China, and India, alongside seasonal demand, continue to support structural growth.
- Tariff-related volatility, tight liquidity, and deteriorating pricing efficiency may trigger sharp price swings despite bullish fundamentals.
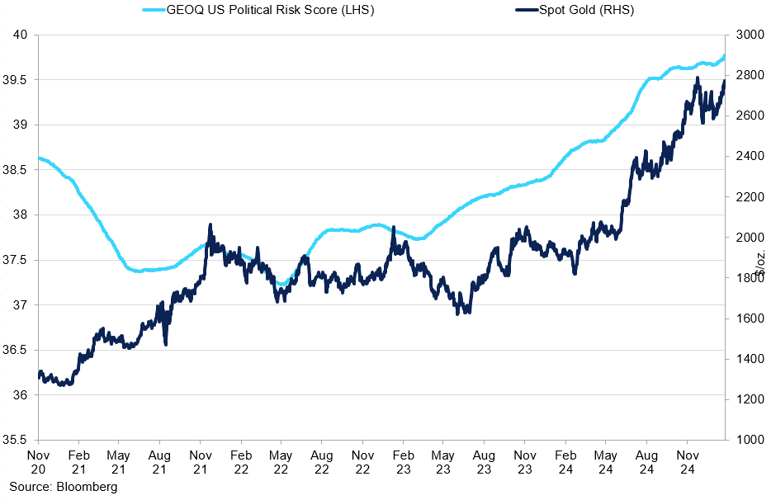
Gold delivered a stellar performance in 2024, reaching an all-time high of $2,790.07/oz in late October and closing the year nearly 27% higher. While a strong dollar kept gold rangebound in the final months of the year, the rally accelerated in early 2025, with gold breaking record highs almost daily since late January. Safe-haven demand continues to outweigh traditional price drivers, pushing the metal above $2,900/oz in February. Historically, higher yields tend to suppress gold prices by increasing the opportunity cost of holding a non-yielding asset. Yet, the inverse correlation has weakened. Gold has performed well despite 10-year US Treasury yields remaining elevated, driven by expectations of more inflationary industrial policies under Trump. This divergence highlights the intensifying demand for gold as a hedge against geopolitical and macroeconomic uncertainty. We expect this trend to be a key price driver in Q1 2025, particularly as markets navigate potential policy shifts and heightened volatility.
GeoQuant’s US Political Risk Score vs Spot Gold
Uncertainty around President Trump's policies drives gold prices higher.
Physical demand remains strong, led by central bank accumulation. In 2024, Poland, Turkey, and India accounted for 70% of total reported net purchases, with Poland leading in Q2 and Q3. The National Bank of Poland (NBP) steadily increased its reserves in response to geopolitical risks and currency concerns stemming from the Ukraine conflict. By year-end, NBP's gold holdings had reached 448.2 tons (14.4 million ounces), with the central bank aiming for gold to comprise 20% of total reserves. China also resumed official gold purchases in late 2024, signalling a renewed interest in gold as a strategic reserve asset. The People’s Bank of China (PBoC) added 10 tons in December, marking its second consecutive monthly purchase. This brought China’s official holdings to 2,280 tons, or 5.5% of total foreign exchange reserves—a 44-ton increase from 2023. China and India continue using gold as a hedge against dollar dependency, reinforcing structural demand. Seasonal demand is also playing a role. The Lunar New Year, historically a peak period for gold purchases in China, has driven strong consumer demand in early 2025. The Shanghai Gold Exchange’s Au9999 contract hit record highs of 648 RMB per gram at the end of January. However, trading volumes have been declining, which may reflect tightening supply conditions driven by resumed central bank purchases or reduced selling from domestic investors. These factors suggest that while demand remains firm, liquidity on the exchange is shrinking, potentially supporting higher prices in the near term.
Meanwhile, tariff-related uncertainty continues to weigh on gold, silver, and platinum. Elevated EFP premia have triggered a surge in gold inflows into COMEX inventories as traders seek arbitrage opportunities. Since early December, COMEX stockpiles have expanded by over 6 million ounces, including record-breaking single-day increases exceeding 1 million ounces in late January. At the same time, implied lease rates for short-term gold lending remain exceptionally high, reflecting tight liquidity for sub-one-month deliveries. With arbitrage constraints and reduced COMEX-OTC swap activity, pricing efficiency has deteriorated, leading to increased market uncertainty. Given these conditions, we anticipate heightened basis volatility, reduced spot liquidity, and greater execution risks in the near term.
Q1 Outlook:
The outlook for gold remains bullish, driven by strong safe-haven demand, ongoing central bank accumulation, and geopolitical uncertainty. The breakdown of gold’s traditional inverse correlation with yields highlights a shift in market sentiment, where investors are increasingly using gold as a hedge against macroeconomic and policy risks. However, structural market constraints, including tariff-driven basis volatility and liquidity challenges, may introduce periods of sharp price swings. Given these factors, we expect gold to remain well-supported in Q1 2025, with the potential to retest and surpass previous record highs, though short-term corrections may occur amid shifting market dynamics. We will closely monitor tariff developments, central bank buying trends, and market liquidity conditions, all of which will shape price action in the months ahead.
Silver

Key Points
- Silver lags behind gold, trading between $30–32/oz, with price movements driven by industrial demand
- Investor interest has softened, with ETF outflows reflecting concerns over tariffs, weaker economic growth, and reduced expectations for Fed rate cuts.
- Strong global solar growth, led by China, is a key long-term demand driver, providing upside potential despite short-term macroeconomic headwinds.
Silver has struggled to catch up with gold, finding a comfortable trading range between $30/oz and $32/oz. The gold-to-silver ratio climbed above 90 in January, indicating that silver is underperforming relative to gold. This widening ratio suggests that while gold benefits from its safe-haven appeal, silver's price remains tethered to its industrial demand dynamics.
While gold’s safe-haven appeal is driving its price higher amidst geopolitical tensions and macroeconomic uncertainties, silver’s strong industrial ties are limiting its upside potential. Industrial demand accounts for approximately 50-55% of total silver demand, making it highly sensitive to global economic conditions. This industrial linkage is reflected in silver's high 30-day correlation with copper, which remained around 0.85 during the first three weeks of January 2025. In contrast, silver's correlation with gold has weakened, emphasising that its price movements are increasingly influenced by industrial factors rather than traditional precious metal trends. We expect silver’s price to continue reflecting its industrial side in Q1 2025, leading to muted performance compared to gold. Given silver's strong correlation with copper recently, it's reasonable to anticipate that silver will continue to act similarly to base metals, making it crucial to monitor base metal market movements for price direction.
silver etf holdings vs spot price
Investor interest in silver has softened in recent months.
Nevertheless, the global expansion of the solar energy sector presents an upside for silver. Silver's exceptional electrical conductivity makes it indispensable in photovoltaic (PV) cells, with the solar industry accounting for approximately 14-15% of silver's total industrial demand. The photovoltaic industry reached 2 TW of installed capacity in 2024, equivalent to the total power generation capacity of the European Union. China led the charge, with installed solar power capacity rising 45.2% in 2024 to 886.67 GW, representing roughly 44% of global capacity. In 2025, China's solar output is expected to grow aggressively, driven by government incentives and declining installation costs. India aims to increase its installed solar capacity to 131 GW by March 2026, while Europe is projected to add 110 GW in 2025. The US set a record in 2024 by adding 37 GW of solar capacity.
Q1 Outlook:
While macro headwinds such as tariffs may limit silver’s upside in Q1 2025, the booming solar industry and ongoing global renewable energy transition present strong long-term demand drivers. As silver increasingly behaves like an industrial metal, base metal trends and economic activity will likely influence its price. However, the solar sector's growth remains a key supportive factor for its price trajectory, keeping it closer to the upper bound of the current range in Q1 2025.
Platinum

Key Points
- Platinum demand in Europe is expected to decline, with diesel car registrations falling 11.4% in 2024
- South African platinum production is forecast to rise by 2% in 2025, but this growth is vulnerable to potential curtailments at loss-making operations.
- Platinum is expected to trade between $950–1,050/oz, with downside risks from weak European demand and resilient supply
We expect platinum to face headwinds in Q1 2025, primarily driven by declining automotive demand in Europe and a modest rise in supply from key producers. Despite these pressures, global dynamics, particularly in China and India, may provide some offsetting support to demand, while supply risks in South Africa remain a key factor to watch.
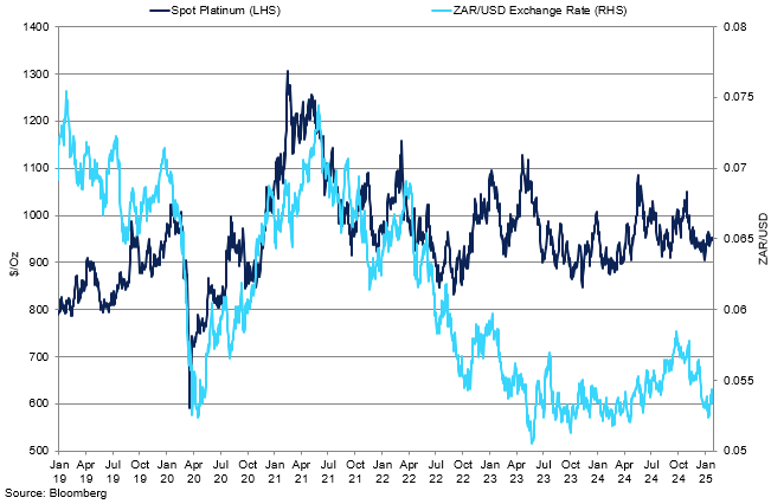
spot platinum vs ZAR/USD Exchange rate
Platinum prices have stabilised around $950/oz, decoupling from the ZAR/USD exchange rate.
The European automotive sector, a key source of platinum demand through diesel autocatalysts, continues to face structural challenges. The diesel share of new car registrations has been in long-term decline, with temporary support from Germany after the removal of BEV subsidies in late 2023. fading by the end of 2024. While diesel car sales in Germany remained stable at around 480,000 units, EU-wide registrations fell by 11.4%, with battery electric vehicles (BEVs) overtaking diesel once again. This trend is expected to persist in 2025, particularly in France, Italy, and Spain, contributing to a projected 4% decline in Western Europe’s platinum autocatalyst demand. The heavy-duty vehicle segment faces similar pressures, as the European truck market contracted by 6.3% in 2024 despite growth in Volvo’s new truck orders in Q3 and Q4. Electrification is gradually eroding diesel’s dominance, with electric heavy-duty vehicles increasing their market share from 3.2% to 4% in 2024. Although diesel still accounts for over 95% of the market, the EU’s 2030 emissions targets will accelerate this shift, posing long-term risks to platinum demand across both passenger and commercial vehicle sectors.
On the supply side, South African platinum production is forecast to rise modestly by 2% in 2025 to 3.9 million ounces, supported by the ramp-up of the Platreef project and increased refining of stockpiled material. Additional contributions from Impala and Anglo American are also expected to bolster output. However, this growth is subject to risks, as a significant portion of South African production remains marginal at current price levels. If loss-making operations face curtailments, this could reverse some of the anticipated supply growth.
Q1 Outlook:
Platinum prices have exhibited heightened volatility, largely due to fluctuating macroeconomic conditions and shifts in automotive demand. The weakness in European demand and the modest supply growth suggest that upside potential may be capped in the near term. However, risks to supply from South Africa could provide price support. We expect platinum to trade in a range of $950–1,050/oz in Q1 2025, with downside risks stemming from weak European demand and potential supply resilience, while upside risks could emerge from unexpected supply disruptions or stronger-than-anticipated growth in Asian markets.
Palladium

Key Points
- Palladium demand continues to fall due to rising BEV and PHEV sales, especially in China.
- Russia’s Nornickel maintains strong output with potential for growth in 2025.
- Prices are expected to stay under pressure, trading between $850–1,000/oz.
The outlook for palladium in Q1 2025 remains subdued, shaped by structural demand headwinds in key automotive markets and steady supply from Russia. While the metal faces a challenging environment, potential supply surprises and shifts in government policies may create pockets of volatility throughout the quarter.
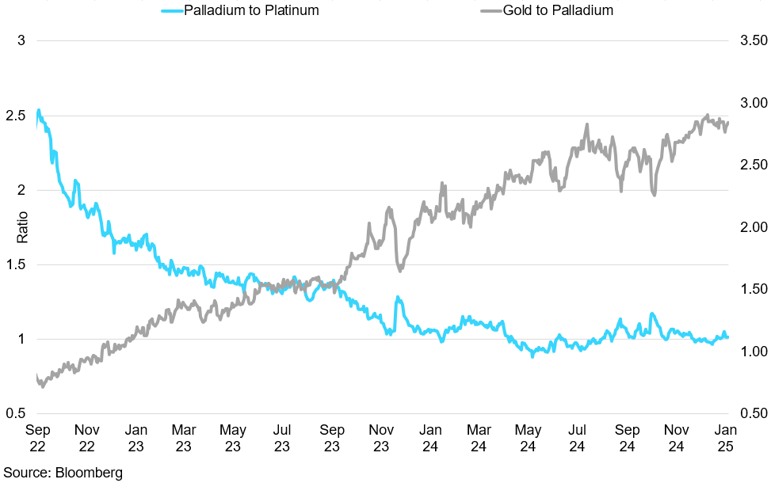
Palladium-To-Platinum vs Gold-To Palladium Ratio
Palladium remains the weakest performer in the precious metal basket.
China and the US, two of the largest automotive markets, are driving the structural decline in global palladium demand due to the rapid growth of battery electric vehicles (BEVs) and plug-in hybrid electric vehicles (PHEVs). In China, passenger car production and sales grew by 5% and 6% YoY in 2024, with Q4 showing strong momentum driven by an 84% surge in PHEV sales and a 15% increase in BEV sales, reaching a record 7.2 million units. Conversely, internal combustion engine (ICE) vehicle sales fell by nearly 2 million units compared to 2023, with ICE market share dropping from 63% to 47%—the steepest decline in China’s history. This shift led to a 21% YoY drop in China’s palladium autocatalyst demand in 2024, with an additional 8% decline expected in 2025 as BEVs continue to gain market share, supported by the government’s extended NEV trade-in scheme. In the US, palladium autocatalyst demand remained relatively stable at around 1 million ounces in 2024, but the long-term trend points toward stagnation and gradual decline beyond 2027–2028 as electrification accelerates. While potential policy changes, such as the repeal of the Inflation Reduction Act (IRA), are unlikely to have a significant impact in 2025, the prospect of reduced subsidies could trigger a short-term boost in BEV sales, further pressuring palladium demand.
On the supply side, Russia’s Nornickel, the world’s largest palladium producer, exceeded its 2024 production targets despite undergoing major smelter refurbishments. Although Q4 output dipped by 10% QoQ due to the temporary shutdown of the Nadezhda flash smelting furnace, the facility is now fully operational, with a 25% increase in smelting capacity. Production guidance for 2025 is set between 2,704 and 2,756 thousand ounces, consistent with 2024 levels. Historically, Nornickel has outperformed its guidance, and with no major maintenance planned for 2025, there is potential for supply to exceed expectations once again.
Q1 Outlook:
Given the structural decline in automotive demand, particularly in China, and steady supply from Russia, palladium faces a challenging environment in Q1 2025. The metal’s price will likely remain under pressure, with downside risks outweighing potential catalysts for significant gains. However, supply disruptions, geopolitical developments, or policy shifts could create short-term volatility. We expect palladium to trade in the range of $850–1,000/oz in Q1 2025, with prices sensitive to fluctuations in global automotive demand and Russian production dynamics. The long-term outlook remains bearish, but short-term price movements will be driven by shifts in supply expectations and macroeconomic factors influencing investor sentiment.

