


Summary
As we head into Q3 2024, the markets are dealing with a different reality than what was initially expected at the beginning of the year. Political uncertainty has gripped the US and Europe due to national elections, raising questions about relationships within these countries. With Biden stepping out of the US Presidential Race, all eyes are likely to stay focused on the US until November. Additionally, there is a growing case for an increasing number of interest rate cuts this year, with major banks expected to start the cutting cycle by the end of this quarter.
While this should help alleviate some of the pressures felt by the commodity space, China's muted economic performance is weighing on the base metals’ narrative. In July, China's highly anticipated Third Plenum did not result in any concrete changes to the fiscal policy support, capping price performance in the meantime. From September onward, we expect macroeconomic factors to relieve some of the pressures on the commodity market, leading to a modest increase in the latter part of Q3. We expect Q4 to bring greater market volatility.
Aluminium
Aluminium prices rose to $2,800/t in Q2 2024, following copper's upward trend. Despite increased speculative interest, fundamental and macroeconomic indicators remain muted, with Chinese output hitting record highs. The supply has grown due to improved refining margins and increased production, but domestic demand lags, leading to SHFE stock accumulation. We expect aluminium to trade between $2,300/t and $2,500/t during the summer, with potential modest increases in late Q3 following key monetary policy decisions.
Copper
Copper was in the spotlight of base metals trading as it strengthened to $11,000/t. COMEX contract activity influenced LME prices, causing significant price gains and a spread between the markets. As a result, we see a more defensive market in the coming months, with a controlled upside expected by the end of the quarter. In the meantime, we anticipate prices will remain under pressure, with strong support levels at $9,200/t and $9,000/t, respectively.
Lead
Despite weak fundamental indicators like low demand during the Chinese battery off-season and high LME stock levels, lead prices jumped higher in Q2. Investment funds' engagement peaked, reflecting increased market sensitivity to speculative appetite. Although Chinese primary lead production declined due to concentrate shortages and smelter maintenance, SHFE prices surged, creating import opportunities. We expect prices to remain subdued in the near term.
Nickel
Nickel, despite experiencing a volatile Q2, has the strongest fundamental narrative to keep prices subdued in the coming months. Continued oversupply from Indonesia remains the main factor affecting the outlook for nickel. Even with prices at current levels, Indonesia can still ensure profitability and continue to supply the market. As a result, we see little appetite for prices breaking significantly higher. Still, we believe nickel's fair value lies between $17,500-18,500/t, where mines can remain profitable.
Tin
Tin prices have been highly volatile in the last quarter, driven by increased speculative interest and supply tightness. Fundamental supply constraints due to Indonesia's backlog in issuing new licenses and Myanmar's tin ban have significantly tightened the market. Despite recent price declines, ongoing supply issues and potential speculative interest suggest that tin prices could rebound above $30,000/t.
Zinc
Like other commodities, zinc followed the upward trend of copper as speculative traders increased their bullish positions. This trend reversed in July, as zinc followed copper to a multi-month low. Still, with fundamental tightness in the Chinese concentrate segment, zinc is more prone to short-term volatility spikes on the upside. We see robust support at $2,650/t, which could cause prices to reverse this trend.
Iron Ore
In Q2 2024, iron ore prices remain muted, reflecting weak confidence in China's construction sector despite government efforts to boost housing demand. The Third Plenum in July did not announce significant fiscal changes, maintaining low confidence in construction sector revival. Iron ore imports fell 4.3% MoM in June, and stainless steel demand remained weak. Despite short-term fluctuations, we expect iron ore prices to stay subdued in Q3 2024.
Gold
Gold's traditionally quiet summer period is expected to give way to renewed momentum, driven by economic factors and potential monetary policy changes. Softening price pressures and a potential September Fed interest rate cut are increasing gold's attractiveness as a non-yielding asset. Robust physical demand for gold, driven by central bank acquisitions and resilient consumer demand in India, supports a positive outlook for the precious metal.
Silver
Silver has traded within a narrow range since the summer began but is expected to follow gold's upward trajectory as US monetary policy shifts. Recent US economic data indicating softening price pressures and a likely Fed interest rate cut in September enhance silver's appeal. The AI boom, particularly driven by Nvidia's rise, is set to boost industrial demand for silver, underscoring its critical role and driving prices higher.
Platinum
Platinum prices have been highly volatile, reflecting fluctuations in gold and silver due to US macroeconomic conditions. Softening EV demand and EU policy shifts favour platinum's use in internal combustion engine vehicles, boosting its market outlook. Rising gold prices are driving increased demand for platinum jewellery, especially in key markets like China and India, supporting a positive price forecast.
Palladium
Palladium prices have remained rangebound between $900-1,100/oz, showing resilience to macroeconomic factors and indicating diminishing interest in the metal as automakers reduce their reliance on Russian supply. Japanese automotive demand for palladium is projected to decline significantly, with a 10% annual drop in new car sales, further dimming the metal's outlook. Despite the anticipated downward trend in palladium prices, market fluctuations driven by short squeezes and increased ETF holdings could result in temporary price spikes.
Macroeconomic Outlook
Global Economy
As Q3'24 unfolds, the global economic outlook indicates moderate growth, bolstered by easing inflationary pressures and resilient manufacturing activity. The IMF's growth forecast of 3.2% highlights a cautiously optimistic economic environment. Global manufacturing production has been resilient, maintaining a near two-and-a-half-year high in June. Output has increased for six consecutive months, particularly in the consumer and intermediate goods sectors. However, investment goods production saw a decline for the second time in three months. Among the 30 nations with June PMI data, 18 reported increased output, with Asia performing particularly well. India, Vietnam, and Thailand showed strong growth, while China and Japan experienced moderate expansions.
In the US, the easing of fiscal policies and stable conditions in Western Europe provide a foundation for continued economic stability. The ECB's recent interest rate cut from 4% to 3.75% and potential further cuts in September are expected to support borrowing and investment, contributing to economic growth. While challenges persist, particularly in business investment and geopolitical uncertainties, the trajectory points toward a sustained recovery. This moderate growth, coupled with resilient manufacturing sectors, suggests a stable yet cautious path forward for the global economy.
Major Economies' CPI
Price pressures softened in June.
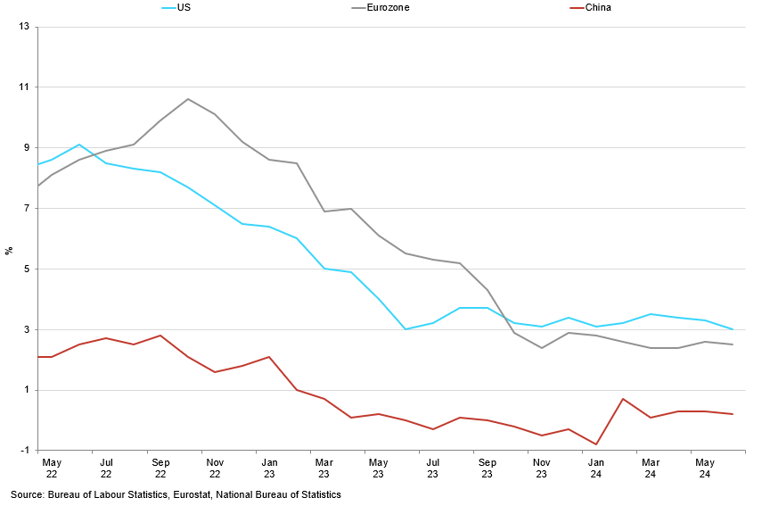
US
As we enter the second half of the year, the impact of the prolonged period of elevated interest rates is becoming more apparent: the labour market is cooling, allowing price pressures to soften and move towards the 2% target. Meanwhile, US economic growth remains stronger compared to its European counterparts, indicating that the risks of a hard landing have been mitigated. The recent GDP report for Q2 2024 met expectations, showing the economy growing at 2% QoQ, supported by resilient consumer spending and business investment. Additionally, key sectors such as technology and healthcare continue to exhibit robust performance, contributing positively to overall economic stability. The stock market has been performing at record highs, driven by optimism around corporate earnings and strong economic fundamentals. The S&P 500 and Nasdaq indices have consistently set new records, reflecting investor confidence in the continued growth of the US economy.
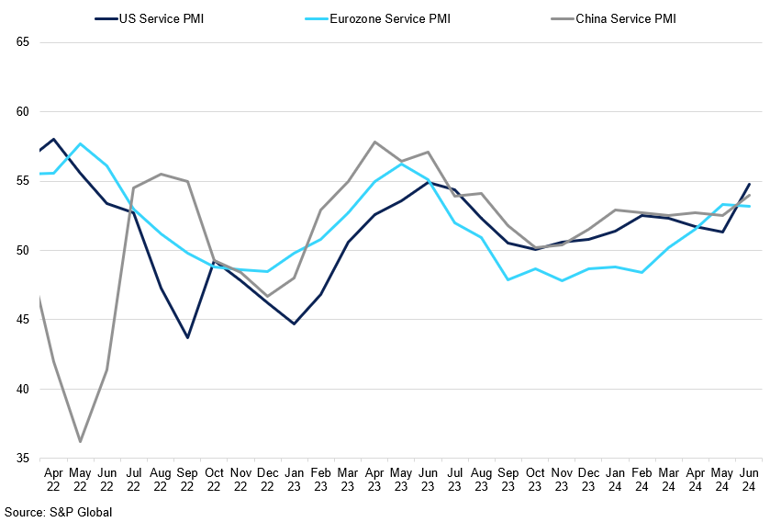
Major Economies' Services PMI
US services rebounded in June.
The uncertainty surrounding the November presidential elections, particularly Biden's exit from the race, has had little impact on the markets so far, the dollar index has remained above the 104.0 level as it remains the most attractive safe-haven currency. We expect the dollar to trade at the current level until September when the Fed will likely begin a monetary easing campaign.
Recently, we have observed a market bias towards US weakness, with significant reactions to labour market data that fell short of expectations. The ADP Employment Change, which estimates monthly changes in non-farm private employment based on payroll data, showed only 150,000 new jobs added in June compared to the expected 165,000. Additionally, the unemployment rate rose slightly to 4.1%. As a result, market expectations for the first Fed interest rate cut in September have increased and is priced in with a 90% probability. The likelihood of monetary easing is further supported by progress in controlling inflation. The Fed's preferred measure of inflation, the core Personal Consumption Expenditure index, fell for the third consecutive month in May to 2.6% YoY, indicating that inflation is moving towards the 2% target.
Looking ahead, the robust stock market performance, driven by strong earnings and investor confidence, alongside resilient economic growth, suggests that the US economy is well-positioned for the current quarter. The anticipated monetary easing by the Fed is expected to provide further support to economic activity, while easing inflationary pressures should bolster consumer confidence and spending. As the global economic environment remains uncertain, the US economy's relative strength and stability will likely continue to attract investment, supporting continued growth and market performance.
Eurozone
Despite lagging behind the US, the Eurozone has managed to avoid a full-blown recession. After five quarters of quasi-stagnation and a slight contraction at the end of 2023, Eurozone GDP grew by a robust 0.3% in the first quarter of 2024. The resilience of the European labour market has been a key factor in the region's economic recovery. Unemployment rates in most Eurozone countries are close to historic lows, which has bolstered consumer confidence and spending. In Q1 2024, job vacancies represented 3% of the workforce, a level too high to significantly push up the unemployment rate. Wages have also been growing faster than consumer prices, with compensation per employee rising by 5.0% YoY in Q1 2024, compared to a 2.9% increase in the consumption deflator.
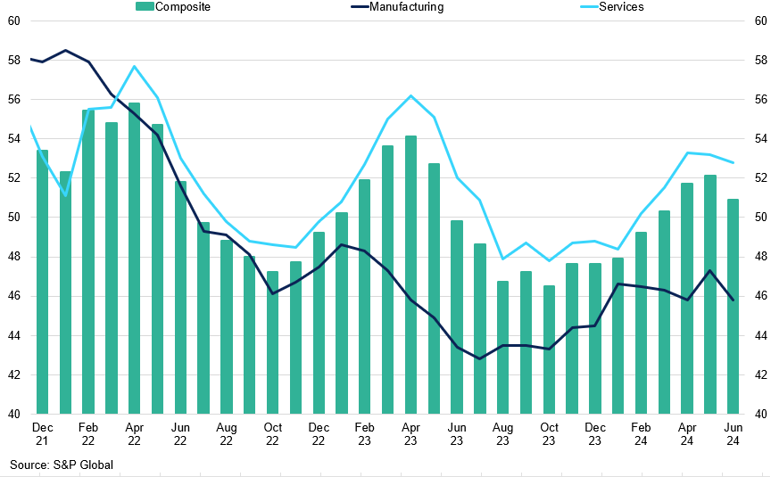
Eurozone Composite vs Manufacturing vs Services PMI
Eurozone manufacturing activity remains in contraction.
Meanwhile, inflation in the Eurozone has shown a complex pattern. After steadily falling to 2.4% in April 2024 from a peak of 10.6% in October 2023, it rebounded by 20 basis points in May 2024 to reach 2.6% in the headline index and 2.9% in the core index. This rebound was widely expected due to base effects from government support for domestic energy prices and public transport in some countries. However, May's rebound highlights the prolonged journey back to the 2% inflation target. Most of the base effects on energy and food prices that caused the inflationary fluctuations are now behind us. The second-round effects, primarily wages, are currently driving inflation. It will take a recovery in productivity or a narrowing of profit margins for inflation to decline further, which is unlikely before mid-2025, given the slow decline in wage growth. Until then, we expect inflation to hover around 2.5%, sustained by the ongoing robust labour market and wage increases. This wage growth outpacing inflation means that households are regaining their purchasing power, further supporting economic activity in the Eurozone.
Monetary policy is also expected to support the Eurozone economy. In June, the ECB cut its main interest rate from an all-time high of 4% to 3.75%. Although the ECB left rates unchanged in July, forward swaps are pricing in an 80% chance of another 25bps cut at the next meeting in September. Lower lending rates are anticipated to boost borrowing and investment, further supporting economic growth. While challenges remain, the overall outlook for the Eurozone economy is cautiously positive, with growth driven by household consumption and the benefits of lower lending rates.
China
Stepping into the second half of the year, muted economic performance has fully established itself as the norm. Over the past few months, sentiment and activity indicators have decreased, culminating in a recent GDP release that came well below consensus expectations. In Q2, China's economy grew by 4.7% YoY, casting a shadow on the 5% goal growth rate set by the communist party for 2024. This makes it even harder to rebuild confidence both at home and abroad. Domestic consumption remains weak, with retail sales in the last few months below the average for the last five years. Persistent low inflation, with the June CPI at 0.3% YoY, a real estate sector still undergoing correction, and households' preference to save all contribute to a local environment that discourages spending. At the same time, China's manufacturing activity fell for a second month in June, while services activity slipped to a five-month low as external demand remains inadequate to absorb China's manufacturing capacity. While exports exceeded forecasts in May, growing trade tensions between Beijing and Western economies, especially given the high probability of Trump's win, make a sustainable export boost unlikely.
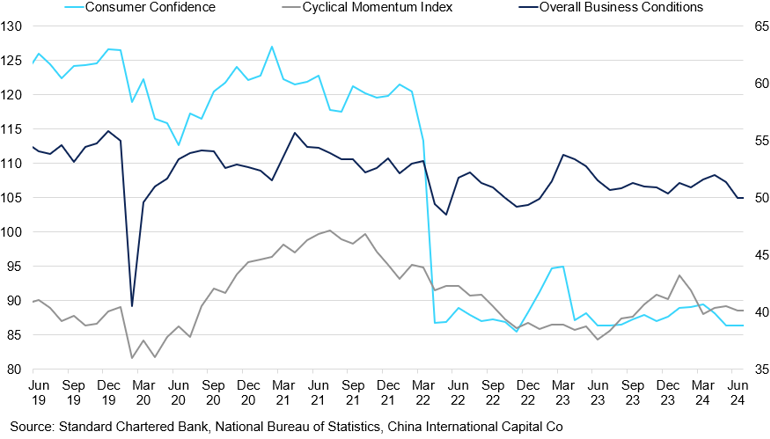
China's Consumer Confidence vs Cyclical Momentum Index vs Overall Business Conditions
Consumer confidence remains at a historical low.
The recent communique from the Third Plenum of the Chinese Communist Party, one of the seven plenary sessions held during each five-year term of the Central Committee, conveyed a sense of urgency by addressing short-term risks and growth objectives. The press conference highlighted potential adjustments in fiscal relations between central and local governments and an acceleration of special-purpose bond issuance to support local governments struggling with debt repayments and operational costs. However, the communique serves only as a foundational executive summary for China's medium- and long-term development and lacks details on the extent of the suggested measures. So far, stimulus policies have proven inadequate to boost domestic and overseas confidence. Past experiences have demonstrated that while ambitious reform agendas can be established, their actual impact depends on the government's ability to implement concrete actions. We believe that significant fiscal stimulus is unlikely this year, making further softening of the Chinese economy inevitable.
Aluminium

Summary
- Aluminium prices reached June 2022 highs of $2,800/t in Q2 2024, driven by strong speculative activity and a strong copper upside in May.
- Despite China's record-high aluminium production, supply uncertainties and high domestic alumina prices suggest a balanced fundamental market, limiting significant price declines.
- Aluminium is expected to trade within $2,300/t to $2,500/t during the summer, with potential modest increases in Q3 due to anticipated monetary policy decisions.
Aluminium, which has a close historical association with copper performance, followed copper's narrative on the upside in recent months. In Q2 2024, aluminium prices strengthened, reaching June 2022 highs of $2,800/t. Throughout the previous year, the entire base metals complex, including aluminium, traded mostly within narrow ranges. A growing interest rate environment restricted cash flows for riskier assets, and a lack of strong fundamental narrative out of China limited speculative involvement in the commodity space. Consequently, market participants largely chose to keep funds on the sidelines, taking advantage of a growing yield environment.
A strong copper upside in May encouraged previously hesitant investors to join the trend, leading to higher speculative activity and increased interest in commodities overall. This also affected aluminium. The net COT positioning of investment funds increased to 110,000 contracts in June, reflecting a growing speculative interest. This occurred despite fundamental and macroeconomic indicators suggesting otherwise. Indeed, there has been a noticeable divergence between base metals prices and macroeconomic indicators, as shown by the weakening correlation between aluminium prices and the dollar. Typically, when there is not a strong fundamental narrative, the dollar tends to guide the market's direction during the day. However, we believe that copper movements influenced the behaviour of the entire base metals group.
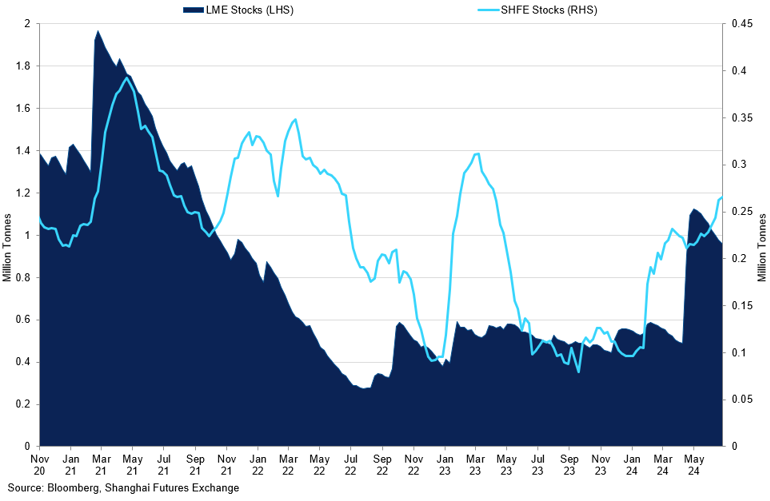
With the easing of upside pressures, markets are now paying attention to the fundamental story to gauge the near-term outlook for aluminium. In comparison to copper, the fundamental supply and demand for aluminium indicate a fairly balanced market. While demand remains largely the same as last year, there has been an increase from the supply-side perspective. Chinese output reached 3.55m mt in June, marking a record-high production for the second consecutive month due to improved refining margins. The largest aluminium producer, Yunnan, has been upgrading production since the end of idled capacity earlier this year, leading to an influx of new material in the market. National production is currently close to an annualised 43.0m mt, almost reaching the record highs from September and October last year. SHFE stocks have reflected this change, reaching 265,000mt, the highest level since May 2023. LME stock also increased to around 1m mt, with most deliveries coming into Malaysian ports.
LME Stocks vs SHFE Stocks
Growing SHFE stocks indicate a lack of domestic demand from end-users.
Despite China's increasing alumina production, which reached 7.13m mt in June, the growth rate is not keeping up with the production of primary aluminium. Consequently, domestic alumina prices soared to CNY4,200/mt, the highest level since late 2021. Although prices have slightly declined from their peak in July, they still remain historically elevated. We anticipate that alumina will continue to support domestic aluminium prices, which have fallen to their lowest levels since March. With ongoing high imports of bauxite from key mining regions, aluminium supply continues to face supply uncertainty in the medium term. This means that while the easing tightness has caused aluminium prices to drop, we do not expect domestic aluminium, and consequently LME prices, to fall below the levels seen in March 2024.
Outlook
While we anticipate that aluminium prices will follow the copper trend in the short term, we expect that any gains will be limited due to a balanced fundamental outlook for the metal. Therefore, during the quieter summer months, we anticipate aluminium trading at the lower end of the $2,300/t to $2,500/t range until September. Starting in September, several important monetary policy decisions by major central banks, particularly the anticipated interest rate cut by the Fed, may relieve some of the pressures on the commodity market, leading to a modest increase in the latter part of Q3. We expect Q4 to bring greater market volatility.
Copper 
Summary
- Copper prices reached record highs of $11,000/t in May 2024, driven by speculative trading and increased investment fund activity on COMEX.
- Despite a recent price stabilisation, tight supply conditions persist due to low COMEX stocks, high shipping costs, and the unexpected closure of First Quantum's Cobre Panama copper mine.
- Copper prices are expected to remain under pressure during the summer, trading between $9,200/t and $9,000/t, with potential for further increases in Q3 due to ongoing supply tightness and speculative interest.
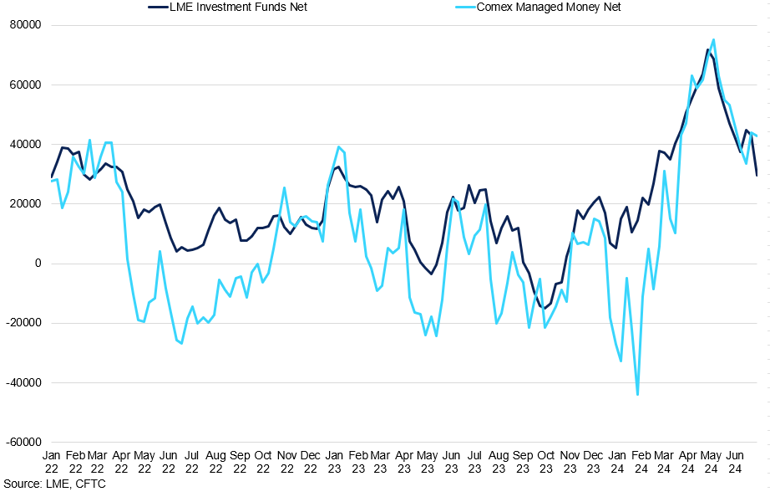
Copper prices were the highlight of Q2 trading, reaching record highs of $11,000/t in May. Although the fundamental outlook for copper is tightening, the surge in Q2 was primarily due to speculative trading rather than fundamental factors. The rally in COMEX contracts influenced LME prices. Higher participation of suppliers on LME prompted investment funds to shift their positioning to COMEX; short covering in that market caused prices to skyrocket to USd513/lb. These price gains widened the spread between LME and COMEX copper prices, reaching $1,200/t. As a result, LME prices caught up with COMEX, reflected in investment fund COT positioning growing to 70,000 contracts, record highs. Subsequently, increased producer participation in the COMEX market helped to balance market supply and demand, leading to a softening of prices by the end of the quarter.
LME and COMEX Investment Side COT Net Positioning
The two markets experienced a joint rally in Q2 2024.
Investors have been unwinding their positions in the past few weeks, and the markets have settled into a quieter summer period with decreased trading volumes and lower volatility. Although the LME market has stabilised after a recent price increase, attention is still on COMEX pricing and spreads. Specifically, COMEX stocks are currently at a record low of 10,000 tonnes, which may not be sufficient to handle a supply squeeze. High shipping costs and premiums make it challenging to deliver material to the market, leading to a tight supply situation that could cause another price surge.
While the base metals narrative is moderately bullish from the fundamental perspective, we believe the gains in Q2 2024 were overextended, as markets got the incentive to break out of the current ranges. The appetite that was previously held back prompted markets to go long and pushed prices above their fair value. This took the appetite out of the market, leading to subsequent price correction. As a result of producer pain experienced during the spike, we believe the market still has more room on the upside, but the timing is now extended, given a defensive market.
From a fundamental perspective, the demand for the material remains relatively stable, similar to last year. However, mine reserves in key regions are declining due to underinvestment, and the expansion of smelter capacity in China has added issues from the concentrate perspective. The supply tightness began with the unexpected closure of First Quantum's Cobre Panama copper mine in November 2023. This resulted in a supply deficit due to increased demand for copper concentrates from copper smelters against limited production growth at copper mines. Treatment charges (TC) have dropped to record lows of $5/mt as a result. We expect TCs to improve slightly due to lower demand but to remain at the lower end of the ranges, given the continued concentrate tightness over the long term.
The premium for copper cathode delivered into China, indicating the country's demand, has fallen to $0/mt. Although China exported more refined copper due to higher prices in May, imports of raw materials remained low, pointing to weak domestic demand. The rise in concentrate import growth is attributed to expanded smelter capacity, which explains the increase in LME inventories, primarily via South Korea and Taiwan. However, from the refined metal viewpoint, we expect this year to be the last year of a balanced market, and supply tightness will accelerate from next year forward.
Outlook
We believe that there is limited downside to the market. However, recent gains have made suppliers cautious about repeating the same story. Along with quieter trading activity during the summer months, this suggests that we will see a more defensive market in the coming months. We anticipate prices will remain under pressure, with strong support levels at $9,200/t and $9,000/t, respectively. Currently, macro factors have little significance in the commodity space, and speculative interest, as reflected in COMEX prices and the COT report, will be crucial in understanding the copper market in Q3 2024.
Lead
Summary
- Lead prices surged to $2,350/t in Q2 2024, driven by speculative interest despite underlying fundamental weakness and traditional indicators suggesting low demand.
- Chinese primary lead production declined by 4.65% YoY in H1 2024 due to concentrate tightness and smelter maintenance, with secondary lead production facing additional pressure from a shortage of battery scrap material.
- Prices are expected to drift lower within the $2,050-2,200/t range in the coming months, influenced by copper sentiment and speculative positioning, with continued volatility due to increased interest from the Bloomberg Commodity Index inclusion.
Our previous report mentioned that fundamental indicators pointed to a lack of demand for lead, given the Chinese battery off-season, wide spreads, and elevated stock levels on LME. Despite these signals continuing in Q2 2024, lead prices defied expectations and surged to $2,350/t—unprecedented heights since April 2022. This rally was primarily driven by speculative interest across the base metals sector, influenced by developments in the copper market, propelling lead higher despite underlying fundamental weakness. Indeed, the correlation between LME prices and traditional market indicators, such as spreads, has weakened, suggesting that recent price fluctuations depart from the norm and are influenced by factors beyond basic supply and demand dynamics.
Notably, investment funds' engagement had reached peaks unseen since August 2023, mirroring the highs that were reached when base metals rallied on macroeconomic signs such as easing US CPI figures and softer monetary policy measures. This surge in interest, partly due to lead's inclusion in the Bloomberg Commodity Index in 2023 and its critical role in both conventional and electric vehicle batteries, underscores lead's growing sensitivity to volatility.
The SHFE market, on the other hand, clearly reflected the tightness in China's domestic market, with lead prices surging close to CNY20,000/mt, creating an opportunity for increased imports due to the arbitrage window opportunity. This is especially prevalent given the ongoing availability of concentrate, which prompted lead concentrate TCs to reach 2009 lows of $20/mt and put further pressure on refined lead production.
LME and SHFE Lead Stocks
LME stocks continued to climb due to the accumulation of off-exchange material.
In particular, Chinese primary lead production declined by 4.65% YoY in H1 2024 on the back of concentrate tightness and smelter maintenance measures in Henan, Anhui, and Inner Mongolia. While the open arb window helped to increase the lead concentrate inventory at key ports by 13,000mt from record lows in June, we believe that is not enough to reverse the concentrate tightness issue and provide relief for smelters over the coming months. As a result, we expect TCs to stabilise between $10-20/mt in Q3 2024.
Given the additional shortage of battery scrap material, secondary lead production is under more pressure than primary output. The shortage led to secondary lead prices increasing above primary, intensifying competition for materials and prompting several major secondary smelters to reduce or halt production in June. With the battery scrap supply not showing significant improvement into July and upcoming policy changes eliminating tax incentives from August 1, secondary lead production is expected to decline further to 242,100mt, according to SMM. Secondary production will likely continue to suffer, weighing on overall production in Q3.
Outlook
Going forward, we expect prices to continue to be influenced by copper sentiment, and speculative positioning will be key in guiding the LME price narrative in the coming months. We expect prices to drift lower to trade within the $2,050-2,200/t range. However, lead volatility is likely to be prominent, given the increased interest in the lead since its introduction in the Bloomberg Commodity Index. SHFE prices are likely to remain elevated despite recent restocking at Chinese ports, keeping LME/SHFE arb intact.
Nickel 
Summary
- Nickel prices followed copper's upward trend in Q2, surpassing $20,000/t but later softened, dropping below $17,000/t due to weakening copper prices and strong correlation.
- Continued oversupply from Indonesia and increasing Chinese nickel inventories due to a lack of domestic demand are expected to keep nickel prices subdued despite short-term fluctuations.
- We anticipate nickel prices to stay low between $17,500-18,500/t, as persistent oversupply and production cost advantages in Indonesia sustain market pressure, with China's economic confidence driving the near-term narrative.
Nickel, in line with the rest of the base metals complex, followed copper's upward trajectory in Q2, surpassing the $20,000/t mark—a level we consider above its fair value. Nonetheless, as the quarter progressed and into July, there was a noticeable softening in nickel prices. This decline was initially tied to the weakening copper prices but quickly intensified, causing nickel to drop below the critical support level of $17,000/t. Indeed, the correlation between nickel and copper reached 80% in July.
Among all the base metals, nickel has the strongest fundamental narrative to keep prices subdued in the coming months. Continued oversupply from Indonesia remains the main factor affecting the outlook for nickel. Production in Indonesia was delayed in the second quarter of 2024 due to a slowdown in permit approvals, supporting a marginal upside in LME prices. Due to ongoing demand from smelters and continued quota delays, Indonesia imported record volumes of nickel ore from the Philippines since April. However, the ongoing rainy season in the Philippines will lead to fewer-than-expected arrivals at Indonesian ports. We expect Philippine ore production to complement Indonesian smelter output, keeping the supply glut intact.
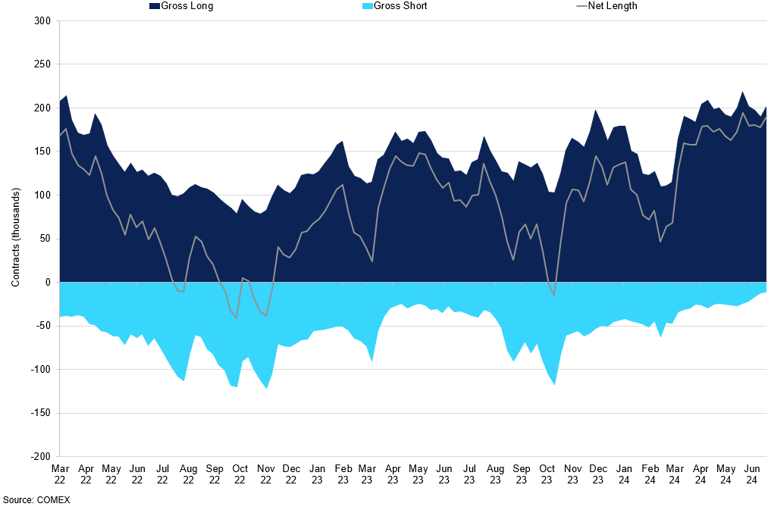
Nickel LME Investment Funds COT Positioning
Investment funds are now as short as they were at the start of this year.
Since the beginning of this year, China's nickel inventories have been increasing in SHFE stock inventory due to the lack of demand from domestic downstream markets. Because of the price differential between the overseas and domestic nickel prices, China's refined nickel producers continue to export nickel. In June, China's refined nickel production totalled 26,600mt, a 40% increase compared to the previous year. This growth was influenced by the end of smelter maintenance and increasing export profits. However, with prices now dropping below $17,000/t, refined nickel production in China is expected to slow down as export margins shrink.
LME inventories are rising, with a notable increase in material arriving at Asian ports. The LME has welcomed the first Indonesian brand to its listings, boosting the influx of materials on the exchange. Despite tighter restrictions on Russian nickel deliveries, including the recent suspension of refined nickel from Norilsk Nickel PJSC's Harjavalta plant in Finland starting October 3, LME stocks are poised to remain elevated. The production cost advantage in Indonesia, with domestic smelters operating at $15,000/t compared to the global average of $16,000/t, encourages continuous output. Even with prices at current levels, Indonesia can still ensure profitability and continue to supply the market. As a result, we see little appetite for prices breaking significantly higher.
Due to historically low nickel prices and continued production in Asia, there have been more production cuts in other regions. Indonesia has been a major contributor to the closures in Western Australia, which is struggling due to the combination of low prices and high production costs. Curtailments are also in place outside of Australia. Glencore Plc stopped its Koniambo Smelter in New Caledonia in February. Additionally, prominent projects at the Huashan and Hanrui refineries have been put on hold, potentially delaying or cancelling 180kt of nickel.
Outlook
We anticipate nickel prices will stay low due to persistent oversupply from Indonesia and the Philippines. Despite short-term fluctuations, we believe nickel's fair value lies between $17,500-18,500/t, where mines can remain profitable. While the coming months might see slight improvements, significant changes in pricing trends are unlikely without a boost in demand. China's economic confidence will be key in driving the near-term narrative. New projects in Indonesia and a sluggish recovery in the stainless steel industry will keep prices in check.
Tin 
Summary
- Tin prices have been highly volatile in the last quarter, driven by increased speculative interest and supply tightness.
- Fundamental supply constraints due to Indonesia's backlog in issuing new licenses and Myanmar's tin ban have significantly tightened the market.
- Despite recent price declines, ongoing supply issues and potential speculative interest suggest that tin prices could rebound above $30,000/t.
Tin has been subject to growing volatility in the last quarter, as increasing speculative interest alongside supply tightness prompted prices to remain elevated. Following the trend of other base metals, tin has risen alongside copper in recent months, breaking out of the stagnant price ranges seen for most of last year. The correlation between tin and copper has turned positive for the first time since 2023, indicating a stronger influence of speculative trends in the markets. The COT report confirms this trend. Although the number of tin contracts is small compared to the copper market, increased investment fund participation has pushed net positioning to reach 3,000 contracts as of the beginning of July.
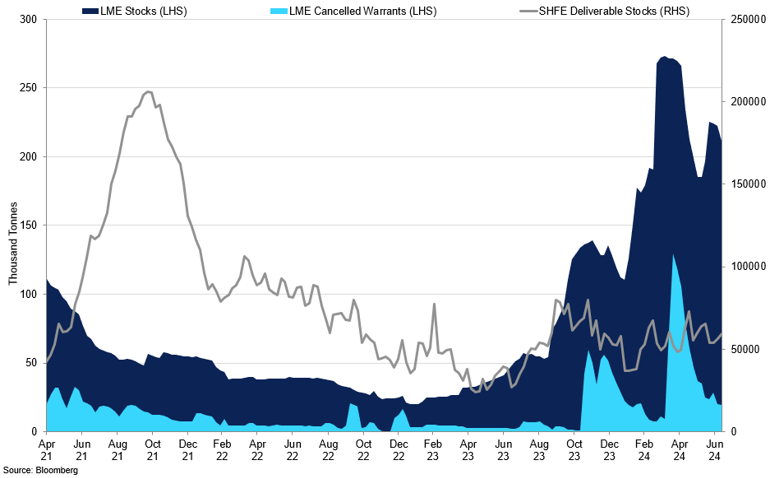
Tin LME Stocks and Cancelled Warrants vs SHFE Deliverable Stocks
SHFE Stocks remain at historically high levels.
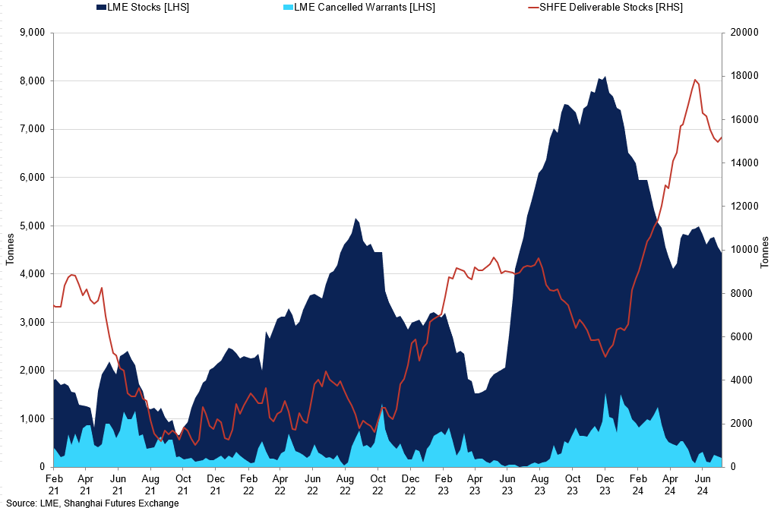
Given the relatively low liquidity in the tin market, any shifts in market sentiment can lead to significant volatility in price movements. As we entered the third quarter of the year, the quieter summer months further reduced liquidity in the market. We believe that tin and other base metals have had a false start to the year due to the bull story that copper created. Even though the copper market softened, tin's high levels in June added to the downward pressure that occurred in July. As a result, tin, which held firmly above the $30,000/t for the majority of Q2, gave up those gains to fall to April lows of $29,300/t. We expect that changes in copper prices influenced tin fluctuations, and when copper fell below $9,500/t, it triggered a bearish trend in the tin market.
However, considering the fundamental narrative, tin has a compelling argument to rise above the $30,000/t level. However, looking at the fundamental narrative, tin has a compelling argument to rise above the $30,000/t level. H1 has seen significant tightness in both raw material and refined metal supplies due to Indonesia's backlog in issuing new licences and Myanmar's tin ban. According to data from the Trade Ministry, Indonesia's refined tin exports dropped 44.20% YoY in June to 4,458.62 metric tons. Shipments of refined tin from Indonesia, the world's largest exporter, have been severely disrupted, with outbound volumes plummeting to 10,292 tons in January-May from 23,887 tons in the same period last year. The flow of raw material from the Wa State tin mines in Myanmar to Chinese smelters has also slowed considerably since a wide-ranging audit was initiated in August last year. China's imports from Myanmar have fallen by 27% YoY so far in 2024, with the slowdown particularly pronounced in April and May. This combination of reduced concentrate flows from Myanmar and refined metal flows from Indonesia has forced buyers to draw on exchange stocks both on the LME and in China.
Due to ongoing operational issues, China's refined tin production decreased by 2.6% in June to 16,280 metric tons. We expect that tin production will continue to decrease in the coming months due to the maintenance of smelter capacity. However, the abundance of scrap supply and stocks in domestic inventory should ease the tightness resulting from lower imports from Indonesia and Myanmar. We believe that fundamental demand in the form of semiconductor purchases is of little importance in the pricing narrative at this moment in time.
Outlook
Heading into the third quarter of 2024, the forecast for tin prices is complex, with a mix of short-term softness due to fundamental factors and longer-term decreases in mined ore supply, all while speculative interests are influencing the market dynamics. We believe the recent downturn in prices was overdone and anticipate a rebound, pushing tin prices back over the $30,000/t mark. However, the typically quieter summer months may lead to increased market volatility, resulting in choppier price movements for tin in the near future.
Zinc 
Summary
- Zinc prices surged in Q2 2024, breaking strong resistance at $3,000/t and reaching a high of $3,185/t, driven by speculative trading and a strong correlation with copper prices.
- Fundamental market tightness persists due to a shortage of zinc concentrate, with mine closures and declining imports into China contributing to record-low concentrate availability and low treatment charges.
- Despite potential short-term volatility and price support around $2,650/t, we anticipate limited significant supply improvements until 2025, with speculative performance playing a key role in zinc's price movements in the coming months.
The price of zinc surged in the second quarter of 2024, breaking through strong resistance at $3,000/t to reach a high of $3,185/t, the highest level since March 2023. Like other commodities, zinc followed the upward trend of copper as speculative traders increased their bullish positions. The LME's Investment Funds COT reached 40,000 contracts, the highest level since the summer of 2022, contributing to the price increase. The growing correlation between the price and COT highs further underscores the involvement of speculative players during that period.
From a fundamental perspective, the shortage of ore supply has not improved. In line with lead, SHFE prices accurately reflect the fundamental narrative. Due to mine closures last year and this year, the supply of mined concentrate has fallen into a deficit. The tight supply of concentrate and increased competition for mined ore have created fundamental tightness in the market. The import of zinc concentrate into China has declined rapidly, dropping by over 20% from January to May. Consequently, the available concentrate in China reached record lows. Additionally, concentrate inventories at Lianyungang have been depleted rapidly and fell to 0mt in June. Treatment charges (TCs) have also decreased, with domestic TCs hitting a new historical low of 275 yuan/mt and imported TCs weakening to $0/dmt.
The import window for zinc concentrate has opened, and the inflow of imported ore may increase in the future. However, due to the shortage of overseas ores and the resumption of production at European smelters, the increase in inflows to the domestic market is expected to be limited. As a result, we anticipate that treatment charges (TCs) will remain low, adding further pressure on smelter profitability and subsequently impacting production in Q3 2024.
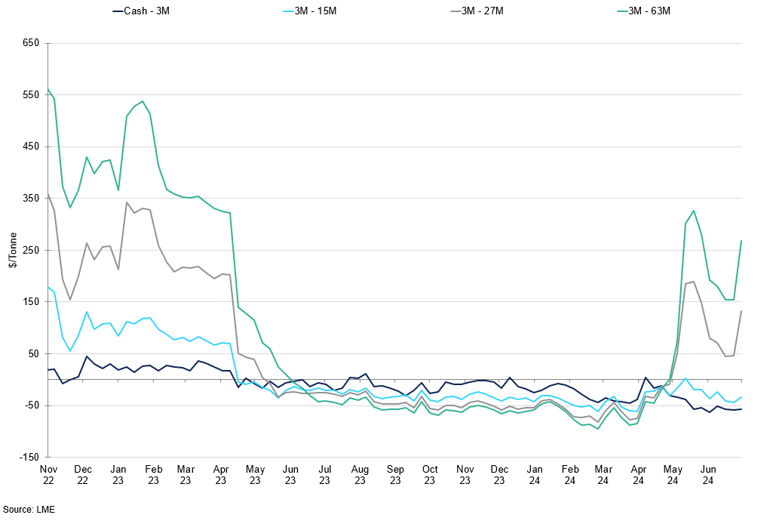
LME Zinc Calendar Spreads
Growing expectations of market tightness over the longer term.
We anticipate that this trend will continue for the rest of the year. Markets are expected to have a shortage of concentrate until we see significant improvements in 2025 due to capacity expansion in China. With prices at $2,800-2,900/t, this might be just enough to encourage thin profit margins. However, we do not expect idled capacity to come back sustainably in the near future. With TCs remaining low, smelters will likely continue cutting production into Q3 2024. This is especially notable given that there are more privately-owned zinc smelters than those for copper, for example. While there is some news of overseas mines restarting, this is unlikely to immediately ease the tightness of the existing concentrate supply.
Moreover, given weak construction sector performance, the demand side has limited upside. Hence, in our view, the supply story will remain key to gauging the fundamental outlook for zinc in 2024. There is little fundamental downside for zinc in the meantime; however, that is not what has driven the price narrative in recent days.
Outlook
As a result, we expect that zinc is more prone to short-term volatility spikes on the upside, given the existing tightness in the concentrate market. Still, speculative performance will be key in driving the narrative for zinc in the coming months. Recent copper softness brought zinc prices lower; however, we see robust support at $2,650/t, which could cause prices to reverse this trend. We expect prices to find new support in the near term before showing controlled upward movements aligned with the movement of copper prices.
Iron Ore and Steel 
Summary
- Iron ore prices struggled to rise above $120/mt in recent months due to weakened confidence in China's construction sector, despite government initiatives to boost housing demand.
- China's GDP grew by 4.7% YoY in Q2 2024, the slowest pace in five quarters, with weak retail sales and declining home prices, indicating persistent weakness in the construction sector.
- Iron ore prices are expected to remain subdued in Q3 2024, with downside risks due to a controlled slowdown in stainless steel demand and quieter construction activity during summer, capping gains above $120/mt.
Iron ore prices are closely linked to changes in the Chinese economy. They are used to indicate the nation's confidence in the construction sector. Initially, a price drop at the start of this year was attributed to weakened confidence in China's construction industry. Policymakers tried to control this slowdown, which helped solidify some support to the market. As a result, iron ore prices have struggled to rise above $120/mt in recent months. Despite government initiatives to boost housing demand, China's property sector has shown signs of weakness, which aligns with overall economic performance. The nation's GDP grew by 4.7% year-on-year in Q2 2024, marking the slowest pace of growth in five quarters and falling below expectations. Although industrial output remained strong, retail sales, which reflect consumer activity, only grew by 2.0%, lower than expected. While this data suggests ongoing growth in the manufacturing sector, domestic home prices continued to decline, indicating persistent weakness in the construction sector. The recent price drop seems to reflect a recalibration of expectations, following earlier optimism about a recovery in this segment at the beginning of the year.
In July, China's Third Plenum was highly anticipated, with expectations of a fiscal policy boost targeted at the construction sector. However, as anticipated, the government speakers announced no concrete changes. Following recent data, confidence in the revival of the construction sector remains low, and it is unlikely that any potential stimulus measures will bring about long-term fundamental changes to the segment. Despite this, iron ore prices remain sensitive to Chinese announcements. We believe that any positive changes within China could cause short-term volatility spikes on the upside, but they will not be sufficient to drive the narrative in the longer term.
China Macroeconomic Environment
The macroeconomic landscape remains subdued.
From the fundamental perspective, the supply data for raw material underscores a lack of demand from end-users. Iron ore imports into China fell by 4.3% MoM to 97.6mt in June, the lowest since February, amid weak stainless steel demand. The current NPI market reflects this trend. NPI prices remain at historical lows, with lower-grade 1.5-1.7% NPI at 3,500 yuan/mt, weighing on Chinese ore purchases. However, higher-grade ore prices are starting to show signs of recovery, providing greater profit margins for Chinese producers. Chinese high-grade NPI production reached 213,000mt in June. Conversely, low-grade NPI production declined, affected by some smelters resuming operations and integrated steel mills, burdened by falling stainless steel prices, opting for external procurement.
In summary, downstream stainless steel consumption warmed up in the short term, but overall demand remained at a seasonal low. The surplus has only slightly improved, with stainless steel mills not yet reducing production. We expect that spot prices will struggle to rise further while raw material prices stabilise. July is still the off-season for stainless steel consumption, meaning the stainless steel contract will have limited upward room in the short term.
Outlook
Looking ahead to Q3 2024, fundamentals are still pointing to downside risks. In particular, there is a controlled slowdown in the demand for stainless steel amid quieter construction activity during the summer months. However, we expect the softness in this segment to begin to reverse later in the year before showing signs of recovery by mid-2025. This will likely keep iron ore prices subdued in the near term, capping gains above $120/mt in the coming months.
Gold 
Summary
- Gold's traditionally quiet summer period is expected to give way to renewed momentum, driven by economic factors and potential monetary policy changes.
- Economic data indicates softening price pressures and a potential September Fed interest rate cut, increasing gold's attractiveness as a non-yielding asset.
- Robust physical demand for gold, driven by central bank acquisitions and resilient consumer demand in India, supports a positive outlook for the precious metal.
Gold has been one of the best performers this year, rising to record highs in May. While the traditionally quiet summer period has recently kept gold in a narrow range, we expect to see gold gain momentum again, breaking the $2,500/oz level as we approach the end of Q3 and the anticipated Fed interest rate cut. While the US presidential race could infuse more volatility, we anticipate that the direction of precious metal prices will be heavily influenced by monetary policy moving forward.
After months of surprises on the upside, recent economic data from the world's largest economy show signs of softening while price pressures ease. The Fed's preferred gauge of inflation - the core Personal Consumption Expenditure index – fell for the third consecutive month in May to 2.6% YoY, suggesting that inflation is moving towards the target of 2%. Recent weeks have shown market bias for US weakness, with pronounced reactions to labour market readings that did not meet expectations. The ADP Employment Change, which estimates monthly changes in non-farm private employment based on payroll data, came in lower than expected for June, showing 150k new jobs added compared to the expected 165k, while the recent unemployment rate ticked higher to 4.1%. The market reacted by increasing the expectations for the first Fed interest rate cut in September – now priced in with a 90% chance. We expect a 25bps cut at the end of the quarter, which should create downward pressure on US Treasury yields, making non-yielding bullion more attractive. While the market has already priced in the interest rate cut, the actual policy decision would reassure investors about the direction of rates in the future, fostering sustained inflows. Moreover, as we get closer to the US elections, we can see an increase in volatility from the lows seen in the holiday season, which we expect will work to gold's advantage.
Gold COT Managed Money
Markets have remained highly bullish so far this year, a trend that we expect to continue in Q3 2024.
Gold's physical demand remains robust, significantly fuelled by major central bank acquisitions, with Turkey taking the lead. Over the past two years, central banks have increasingly focused on gold as a more secure asset than the dollar, making 2022 and 2023 record years for annual purchases. A recent World Gold Council survey indicates that this trend is set to continue this year, with nearly 13% of advanced economies planning to increase their gold holdings within the next year, the highest level since the survey began. Simultaneously, global consumer demand for gold remains resilient despite its record-breaking performance. While the sharp rise in gold prices has dampened demand in China, where the ongoing property sector crisis continues to affect consumer purchasing power, gold imports to India remained strong in May, signalling above-average levels of gold purchasing. High gold imports around mid-year typically translate to robust jewellery production for festivals in the third quarter. Given that India's jewellery consumption accounts for 20% of the world's total, and it is the second-largest consumer market for gold, expectations of strong economic growth in the country, where gold's role as a store of value is well established, should work to the precious metal's advantage.
Outlook
Overall, we expect gold to gain momentum, breaking the $2,500/oz level as we approach the end of Q3 and the anticipated Fed interest rate cut. With resilient physical demand and robust central bank acquisitions, alongside easing inflation and increased market volatility, gold's outlook remains positive.
Silver 
Summary
- Silver has traded within a narrow range since the summer began but is expected to follow gold's upward trajectory as US monetary policy shifts.
- Recent US economic data showing softening price pressures and a likely Fed interest rate cut in September enhance silver's attractiveness as a non-yielding asset.
- The AI boom, particularly driven by Nvidia's rise, is set to boost industrial demand for silver, underscoring its critical role and driving prices higher.
Similarly to gold, silver trading has been rangebound since the summer months started, albeit recording less pronounced highs and deeper lows as muted global sentiment weighted on the industrial side of the metal. Still, the correlation between gold and silver has remained high at around 90% in recent weeks. While softness in the US economy, worse-than-expected economic performance in China, and continued contraction in Europe's manufacturing might constrain silver's performance, it will likely follow gold on the upside as we approach a switch in US monetary policy. We expect the metal to find support at $28.6/oz before rebounding, breaking the $32/oz level at the end of Q3 2024.
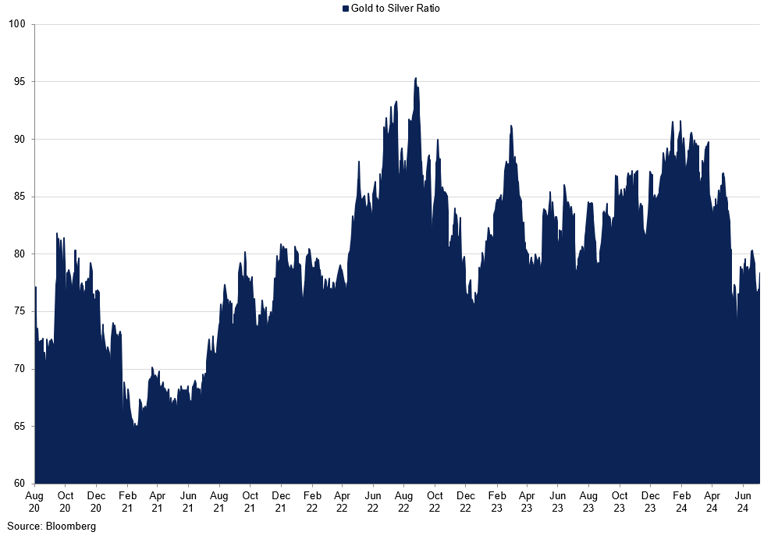
Gold to Silver Ratio
The ratio has weakened in Q2 as silver gains caught up with gold.
After months of solid performance, recent economic data from the US is starting to show signs of softening, with easing price pressures. The core Personal Consumption Expenditure index, the Fed's preferred measure of inflation, fell for the third consecutive month in May to 2.6% YoY, indicating progress towards the target of 2%. Recently, market sentiment has leaned towards US economic weakness, with notable reactions to labour market data that fell short of expectations. The ADP Employment Change report for June showed 150k new jobs added, below the expected 165k, while the unemployment rate edged up to 4.1%. This has increased market expectations for a Fed interest rate cut in September, now priced at a 90% probability. We anticipate a 25bps cut by the end of the quarter, which should lower US Treasury yields and make non-yielding bullion like silver more attractive. Although the market already factored in the rate cut, the official decision would clarify future rate directions, encouraging sustained investments. Additionally, we expect increased volatility as the US elections approach, which could benefit silver as a safe-haven asset.
From an industrial perspective, the AI boom, underscored by Nvidia's meteoric rise to become the world's most valuable company in June, significantly boosts an essential electric conductor metal used extensively in various electronics. Nvidia, originally known for producing video game chips, has transformed into a global powerhouse. Its profits have surged amid the tech industry's immense shift towards artificial intelligence, with major companies seeking Nvidia's products to serve as the backbone of this technology. The company's growth has outpaced tech giants like Google and Apple, fuelling a wave of investment and market speculation. Nvidia's stock has surged about 180% this year, compared to a 19% rise in Microsoft shares, as demand for its top-of-the-line processors outpaces supply. Companies like Microsoft, Meta Platforms, and Alphabet are racing to build their AI-computing capabilities and dominate the emerging technology. The expanding artificial intelligence sector will likely drive new industrial demand for silver. The rapid growth of generative AI will necessitate substantial upgrades to existing infrastructure and hardware to support its broader application across the economy. Advanced semiconductors, data centres, and consumer electronics are all poised for a significant increase in demand. Furthermore, the growth of AI-powered computing and power-intensive data centres will lead to massive electricity consumption. The IEA projects that power demand from data centres will exceed 1,000 TWh by 2026, which is comparable to Japan's total power demand and nearly double the consumption of data centres in 2022. This surge in industrial demand and increased power usage underscores silver's critical role, potentially driving its prices higher as the AI revolution progresses.
Outlook
Overall, with the Fed interest rate cuts on the horizon and the upcoming US elections, alongside encouraging developments in industrial demand, we expect silver to gain attractiveness as both a safe-haven asset and a vital industrial metal. We anticipate the price of silver to appreciate by the end of the quarter, surpassing $32/oz in Q3 2024.
Platinum 
Summary
- Platinum prices have been highly volatile, reflecting fluctuations in gold and silver due to US macroeconomic conditions.
- Softening EV demand and EU policy shifts favour platinum's use in internal combustion engine vehicles, boosting its market outlook.
- Rising gold prices are driving increased demand for platinum jewellery, especially in key markets like China and India, supporting a positive price forecast.
In recent months, platinum prices have mirrored the fluctuations of gold and silver, influenced by softening macroeconomic data from the US. However, the price swings in platinum are more pronounced due to its lower liquidity than gold and silver, which heightens its susceptibility to broader price volatility. In July, the price of platinum took a hit, following other base metals, and stabilised at $950/oz, a support level we anticipate will hold through Q3 2024.
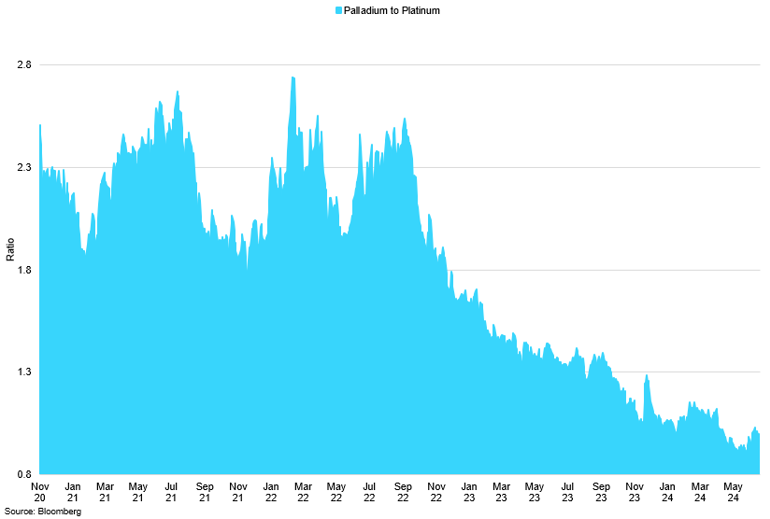
Palladium to Platinum Ratio
The ratio continued to decline as palladium suffered major price losses.
The outlook for platinum appears increasingly positive based on current trends in electric vehicle (EV) sales and consumer preferences. Recent data indicates a significant softening in EV demand across Europe, with new EV sales in the EU dropping by 12% YoY in May. This decline is particularly pronounced in Germany, the bloc's largest EV market, which saw a 30% YoY slump. The reduction in subsidies for EV buyers as part of Germany's last-minute 2024 budget deal has contributed to a 16% year-to-date decrease in EV sales. The EU's ambitious target to phase out sales of new internal combustion engine (ICE) vehicles by 2035 is under strain, especially following the recent EU election results. The victories of the conservative CDU and CSU parties in Germany, along with their EPP group allies across Europe, have raised doubts about the 2035 ban on new ICE cars. These parties have pledged to reverse the policy, emphasising the continued relevance of ICE vehicles. Moreover, the European Commission's decision to hike tariffs up to 48% on vehicles imported from China further complicates the EV market. This move, aimed at protecting the European automotive industry from what the EU perceives as illegal subsidies from China, will likely keep EV prices high, making them less accessible to average consumers. Consequently, consumers may increasingly opt for more affordable ICE vehicles over EVs. This trend is favourable for platinum, which is extensively used in autocatalysts. As the demand for ICE vehicles remains robust or even grows, the demand for platinum is expected to strengthen. Given the shifting political landscape and economic pressures, the anticipated reduction in EV enthusiasm will likely bolster the autocatalyst market, driving higher platinum demand. The metal's critical role in autocatalysts positions it well to benefit from these trends, potentially leading to increased prices and market stability for platinum in the near term.
The outlook for platinum is bolstered not only by trends in the automotive industry but also by a resurgence in demand for platinum jewellery driven by higher gold prices. As gold prices continue to rise, consumers increasingly turn to platinum as a more affordable yet equally prestigious alternative. This trend is particularly evident in key markets such as China and India, where platinum jewellery is gaining popularity due to its price advantage over gold. The price-sensitive nature of these markets means that as gold becomes more expensive, platinum becomes a more attractive option for both consumers and investors. Additionally, the appeal of platinum's durability and aesthetic qualities enhances its desirability. Jewellers are capitalising on this shift by expanding their platinum collections, further stimulating demand. As a result, the higher demand for platinum jewellery we expect will support platinum prices and contribute to a positive outlook for the metal, complementing its strong industrial demand.
Outlook
Overall, we expect platinum to benefit from current trends, with the outlook for platinum remaining moderately bullish. We anticipate the metal to trade between $975-1075/oz. The combination of increased demand for platinum jewellery driven by higher gold prices and the sustained relevance of internal combustion engine vehicles suggests a stable to positive trajectory for platinum prices.
Palladium 
Summary
- Palladium prices have remained rangebound between $900-1,100/oz, showing resilience to macroeconomic factors and indicating diminishing interest in the metal as automakers reduce their reliance on Russian supply.
- Japanese automotive demand for palladium is projected to decline significantly, with a 10% annual drop in new car sales, further dimming the metal's outlook.
- Despite the anticipated downward trend in palladium prices, market fluctuations driven by short squeezes and increased ETF holdings could result in temporary price spikes.
In the first half of the year, the prices of precious metals increased, largely driven by gold's strong performance. However, palladium stood out as the exception, continuing trading in a narrow range of $900-1,100/oz. The continuous decline in palladium prices indicates that macroeconomic factors have a minimal impact on palladium in contrast to other precious metals. The fact that its price has fallen by almost 40% over the past year suggests a diminishing interest and confidence in the metal. Given that Russia contributes to approximately 40% of global palladium production, the ongoing conflict in Ukraine has led automakers to reduce their dependence on palladium, casting a bleak outlook for a metal once the preferred choice for autocatalyst production.
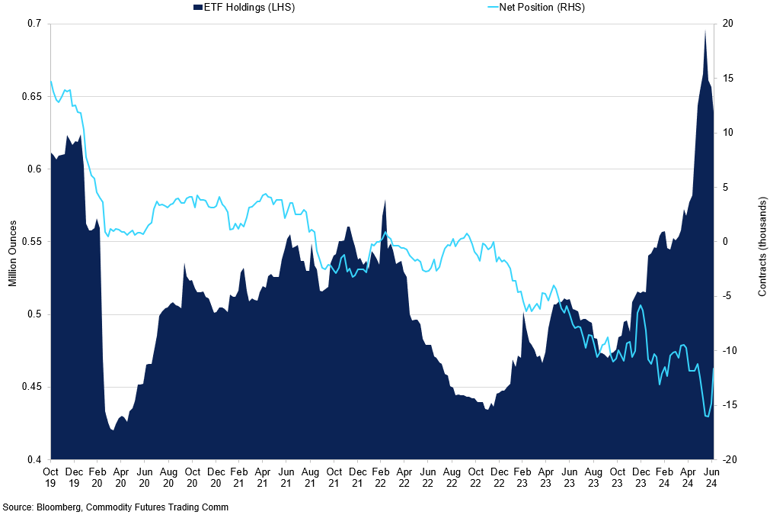
Palladium ETF Holdings vs Net Position
ETF holdings have increased recently.
From the demand side, Japanese auto demand is expected to soften this year. As the third-largest single-country market for automotive palladium, Japan saw a 5% YoY decline in light-duty vehicle (LDV) sales in June 2024, marking the sixth consecutive month of negative growth and dimming the outlook for palladium demand this year. Sales have been hampered by shipment suspensions for certain Toyota and Mazda models and earlier production cuts at Toyota and Daihatsu. Sales dropped to 374,000 units in June from 393,000 in the same month last year. Compared to pre-pandemic levels in June 2019, the drop is more significant, with sales down by 17%. Prior to these disruptions, Japanese LDV sales were recovering, with a 14% YoY increase in monthly average sales in 2023 and sequential growth for 16 consecutive months. However, current year-to-date monthly averages indicate around a 10% annual decline in new car sales. Consequently, Japan's palladium automotive demand is projected to decrease by a similar margin to 670 koz, approximately 8% lower YoY. This decline outpaces the global automotive palladium demand, which is forecast to drop by about 2% YoY to 7.9 moz.
Although we anticipate an overall decline in palladium prices in the upcoming quarter, the market may experience fluctuations and range trading due to temporary price increases driven by short squeezes. The recent significant accumulation of palladium by ETFs has considerably tightened market liquidity. Since April, global palladium ETFs have amassed 107 koz, marking the largest three-month accumulation since mid-2017 and pushing ETF holdings to a six-year high. This hoarding of metal by ETFs reduces the available supply in the market, exacerbating liquidity constraints. Recent market indicators highlight these liquidity issues. There has been a notable spike in short-term implied lease rates for palladium, reflecting higher costs for borrowing the metal and suggesting immediate supply shortages. Additionally, the futures curve recently showed backwardation, with near-term contracts priced higher than those with longer expirations, underscoring short-term supply pressures. Simultaneously, the number of short contracts on the NYMEX has risen, indicating a significant bet against palladium prices. The constrained physical liquidity likely contributed to a price rally in mid-June, possibly due to short sellers closing their positions. While prices have since reverted to previous levels, the substantial short positions still present in the futures market suggest the potential for further short-covering rallies. If palladium ETF holdings continue to grow, deepening the expected significant market deficit this year, the conditions for additional short squeezes are heightened.
Outlook
Therefore, despite the anticipated downward trend in palladium prices for the next quarter, we should be prepared for periods of volatility. These fluctuations, marked by temporary price spikes, will likely result from short squeezes as traders cover their positions in response to rising prices, creating opportunities for range trading of $850-1,050/oz within the broader declining trend.

