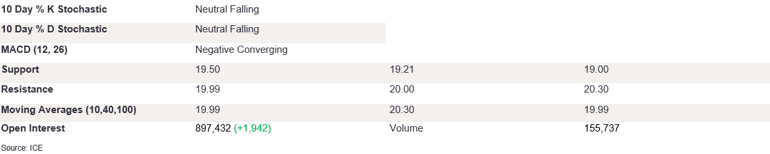
NY 2nd Month Sugar Futures

NY sugar futures opened lower but managed to close higher day-on-day at 19.85. The stochastics are falling, and the MACD diff is negative and diverging. However, both indicators point to slowing downside momentum. On the upside, futures need to break above the robust resistance levels of 20.00 and 40 DMA at 20.30 to trigger the momentum. Prices would then need to take out the 21.44 level to confirm the longer-term outlook. Conversely, appetite for prices below the recent support of 19.50 could trigger a test of support of 19.21 before 19.00. Another dragonfly doji candle shows rejection of lower prices; however, there is not enough indication that the moderate downside trend we saw in the last couple of days would reverse in the near term. We expect futures to test the lows in the meantime.
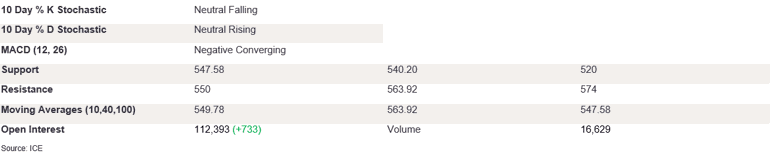
Ldn 2nd Month Sugar Futures

Ldn sugar futures failed above the previous day’s highs once again on Friday as intraday trading caused them to close at 548.30. The stochastics are painting a mixed picture, with rising but converging %K/%D stochastics, as the MACD diff is negative and flat. This suggests that futures lack the directional appetite to prompt prices to break out of the current ranges. In particular, Friday’s trading formed a candle with a short body but a longer lower wick, confirming a lack of appetite for lower prices. If prices were to break back above the 10 DMA level at 549.78, this could trigger a test of 550 and then 40 DMA at 563.92. To suggest a bearish candle, futures need to take out support at 100 DMA at 547.58 and then at 540.20. A break below this level would confirm the outlook for lower prices.
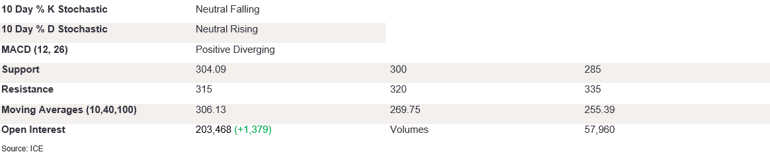
NY 2nd Month Coffee Futures

NY coffee futures gained ground on Friday as buying pressure triggered a close on the front foot above 10 DMA at 313.50. The stochastics indicate the end of the recent bear trend, with the %K/%D converging on the upside, as the MACD diff is positive and diverging on the upside, outlining growing buying pressures. This suggests we could see higher prices in the near term towards 320, but the market needs to take out immediate trend resistance of 315. On the downside, the candle found support at 300, and if the prices break through this level, we could see futures retreat back through the regression line at 285 before 270. Friday’s bullish candle created a three white soldier formation, and a break above the trend resistance could confirm further bullish momentum in the near term.
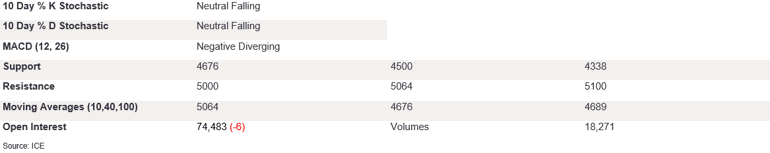
Ldn 2nd Month Coffee Futures

Ldn coffee futures jumped higher on Friday and managed to close above the 40 and 100 DMA levels at 4873. The indicators suggest we could see higher prices in the near term. The stochastics are converged on the upside, and the MACD diff is negative and diverging, yet to indicate the trend change. We expect futures to edge higher in the near term towards 10 DMA at 5064; however, futures first need to take out the robust level on the upside at 5000. On the downside, if futures fail into the longer-term Mas at 4676 once again, then we could see prices break back below 4500. We expect futures to be firm in the near term, and if prices break the 10 DMA completely, this could provide a strong signal of the upside.
NY 2nd Month Cocoa Futures

NY cocoa futures gained ground on Friday but struggled above the 10000 resistance to close at 9853. The stochastics are rising, with the %K/%D edging higher in the overbought, as the MACD diff is positive and diverging. This suggests we could see further bullish momentum in the near term, with prices breaking above 10000 before testing the June highs of 10150. On the downside, the candle found support at 10 DMA at 9212, and if the prices break through this level, we could see prices retreat back to 9000. The bullish candle with a long body and a longer upper wick points to a lack of appetite above the 10000 level in the near term.
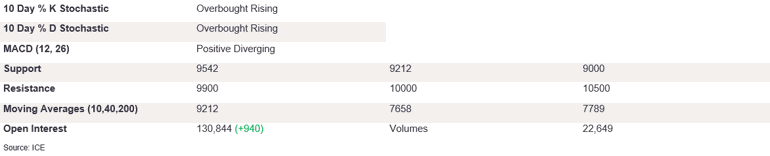
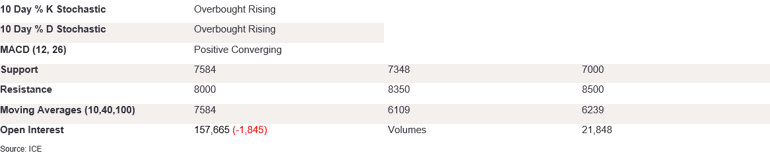
Ldn 2nd Month Cocoa Futures

Ldn cocoa strengthened on Friday as protracted buying pressure triggered a close on the front foot at 7854. The stochastics are rising, with %K/%D diverging on the upside in the overbought. The MACD diff is positive and diverging. A candle with a long upper wick suggests hesitation above the 8000 resistance level. A break above this level could set the scene for higher prices to break above the resistance at 8500. This would confirm the trend for rising prices, up to the 9000. On the downside, a breach of support at 10 DMA at 7584 would strengthen the bearish momentum. This could also trigger losses towards the 7348. Indicators point to higher prices. However, the narrowing candle body suggests a diminishing appetite for further bullish momentum; we expect futures to retest the highs today.