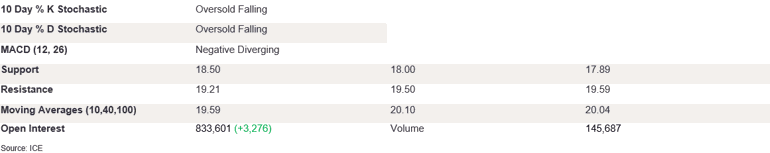
NY 2nd Month Sugar Futures

NY sugar futures sold off yesterday after investors rejected prices above 19.20, prompting a close below 19.00, at 18.53. The stochastics are falling, with %K/%D now in the oversold territory, suggesting a short-term negative trend. The MACD diff is negative and diverging, indicating improving sentiment on the downside. To confirm another bearish candle and form the three black crows’ formation, prices need to break below the support level at 18.50 before 18.00 and 17.89 – an August low. On the upside, to regain upside conviction, futures need to close back above 19.00 and then 19.50 in the near term. Near-term momentum is on the downside; the close below the key support levels confirms this trend.
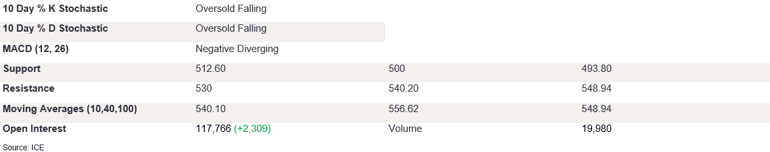
Ldn 2nd Month Sugar Futures

Ldn sugar futures sold off yesterday due to a lack of appetite for prices above 530 to 516.90. A close below 512.60 could trigger losses back to 500 support in the near term. The stochastics are falling, and this could improve downside momentum; the MACD diff is starting to weaken, supporting the outlook for lower prices. A break of the 500 support may pave the way for lower prices to the 493.80 level – an August low. On the upside, if prices can take out 530 and then 10 DMA at 540.10, this would confirm the return to the trend range that was maintained in the last couple of months. We believe that there is an appetite for lower prices in the near term.
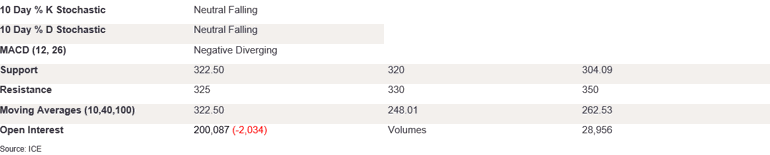
NY 2nd Month Coffee Futures

NY coffee futures opened lower, but support at 10 DMA caused a close above this level at 324.95. The %K/%D is flat. The MACD diff is negative and also flat, suggesting indecision in the market for prices outside of these levels. To suggest lower prices, futures need to take out 10 DMA at 322.50. A break below this level towards 304 would confirm the strong bearish momentum to 300. Conversely, appetite for prices above 340 could trigger a test of recent highs at 350. A spinning top candle formation signals uncertainty about the outlook for either direction. To confirm the outlook on the downside, a break below the key support of 10 DMA in the near term is needed.
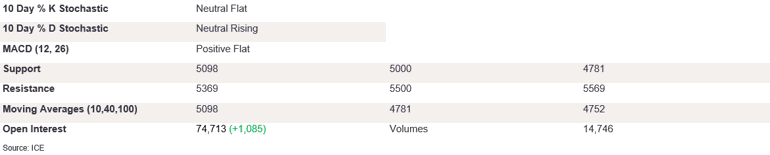
Ldn 2nd Month Coffee Futures

Ldn coffee futures edged lower yesterday as moderate selling pressure triggered a close at 5168. The stochastics are rising yet converging, with the %K flattening out; the MACD diff is positive and flat. A break of the 10 DMA at 5098 could trigger losses through 5000, with the tertiary support level at 40 DMA at 4781. On the upside, a break above previous sessions’ highs at 5370 could set the scene for a test of 5500, pointing to a change of trend for more bullish momentum. Yesterday’s bearish spinning top formation points to market indecisiveness about the outlook for higher prices, and we need the futures to break support at 5000 to confirm the outlook for lower prices in the near term.
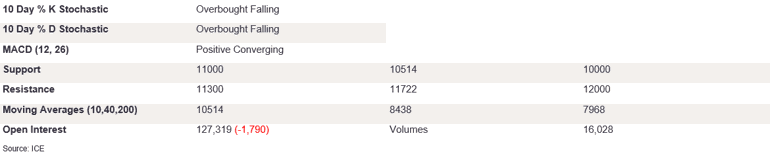
NY 2nd Month Cocoa Futures

NY cocoa futures opened higher yesterday but struggled to break significantly higher, prompting a close on the back foot at 11303. The %K/%D is diverging on the downside in the overbought territory. The MACD diff is positive and converging, a clear sell signal. The indicators point to lower prices in the near term, and to confirm the rejection of the support, prices need to take out 11000. A break below this level towards the 10 DMA at 10514 would confirm the strong bearish momentum. Conversely, appetite for prices above the 11500 level could trigger a test of the April high at 11722. A spinning top candle signals uncertainty about the outlook for trend reversal, and a break below the key support confirms there is more appetite for downside potential.
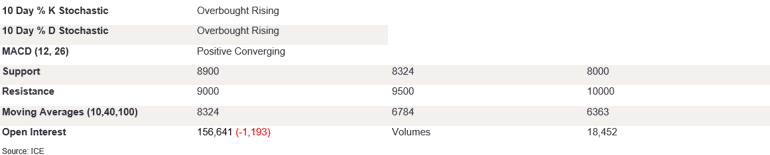
Ldn 2nd Month Cocoa Futures

Ldn cocoa futures softened yesterday after finding resistance at 9000. The market closed at 8905. The stochastics are gaining ground in the overbought territory, and the MACD diff is positive and diverging, suggesting we could see higher prices in the near term through the trend resistance. A break above 9000 would bring into play the 9500 level, which could set the scene for 10000. On the downside, futures need to break below 10 DMA at 8324 in order to confirm downside momentum. The appetite below that level could trigger losses towards 8000; this could strengthen the trend in the long run on the downside. The hanging man formation points to an end of the uptrend. However, the short candle body signals uncertainty about the change of trend in the meantime.